Continuing from the previous article, we have already systematically explained what NCCL is actually testing, as well as common misconceptions and the data points that truly matter.
How to Read NCCL Test Results and What Really Matters for AI Clusters
This article is more hands-on. It provides a practical, “ready-to-use” guide for quickly interpreting NCCL test reports. Overall, this article is focused on actionable methodology. It minimizes conceptual explanations and emphasizes direct application and practical interpretation.
Table of Contents
Core Understanding (Must-Read First)
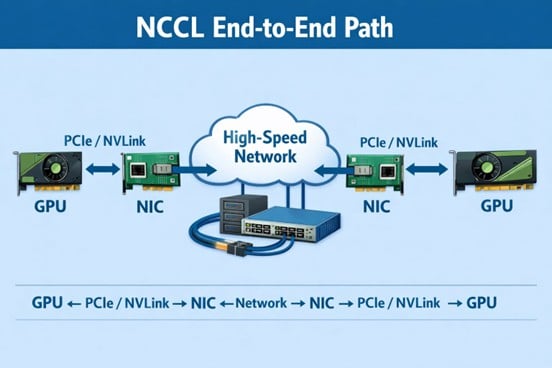
A NCCL report is neither a GPU benchmark nor a network benchmark. It is: A system-level outcome shaped by the network acting on GPU-generated communication signals under scale.The communication path is: GPU → NVLink / PCIe → NIC → Network → NIC → GPU
NCCL does not tell you where the problem is. It only shows: how the system behaves under different scales.
1. Three Key Questions (Entry Framework)
Before reading any NCCL report, always answer:
- Is it fast or slow?
- Why is it fast or slow?
- Where is the bottleneck?
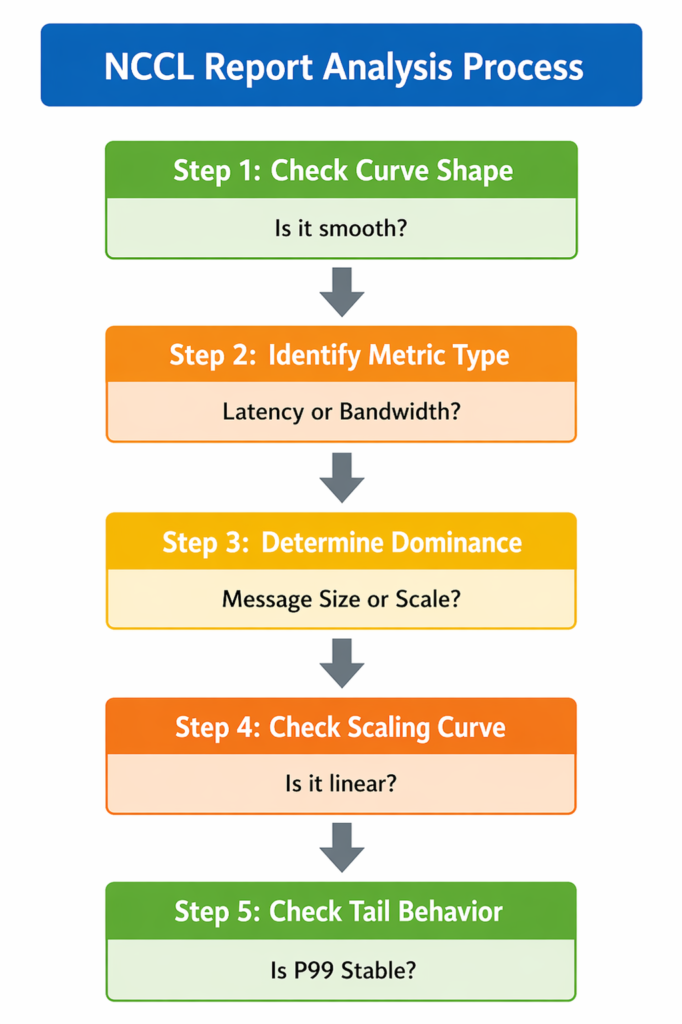
2. Layer 1: Quick Health Check (Look at Shape, Not Numbers)
❌ Wrong approach: Start by looking at bandwidth (Gbps)
✔ Correct approach:First inspect curve behavior:
- Is Message Size vs Bandwidth smooth?
- Do small / medium / large messages transition continuously?
- Are there discontinuities, steps, or drops?
✔Interpretation Rules
- Smooth curve → system is healthy
- Small message anomaly → latency / scheduling issue
- Large message anomaly → bandwidth / network issue
- Broken curve → definite bottleneck (GPU or network)
3. Layer 2: Metric Decomposition (Latency vs Bandwidth)
① Latency-bound metrics
- Small message performance → scheduling efficiency
- P95 / P99 latency→ network jitter
- •Step time variance→ CPU / protocol overhead
| Metric | What It Measures | System-Level Meaning |
| Small Message Performance | Performance of short, frequent communication operations | Reflects scheduling efficiency and CPU / protocol stack overhead. Poor performance usually indicates excessive control-plane cost or inefficient message handling. |
| P95 / P99 Latency | Tail latency of communication operations under load | Reflects network jitter and instability. High tail latency indicates congestion, queuing imbalance, or inconsistent routing behavior. |
| Step Time Variance | Variation of training step completion time across iterations | Reflects system-level synchronization stability, including both scheduling consistency and network-induced jitter. High variance indicates unstable GPU coordination. |
② Bandwidth-bound metrics
- Large message throughput → Reflects network link capability
- Bus Bandwidth→ Reflects topology efficiency
- Algorithm Bandwidth → Reflects ability to reach physical bandwidth limits
| Metric | What It Measures | System-Level Meaning |
| Large Message Throughput | Performance of large-scale data transfers under NCCL collective operations | Reflects the effective data transfer capacity of the network under high load, especially when communication becomes bandwidth-dominated. |
| Bus Bandwidth | Raw end-to-end data movement rate across GPU → NIC → network → GPU path | Reflects the physical network link capability, including NIC throughput and actual achievable transport bandwidth. |
| Algorithm Bandwidth | Effective throughput after accounting for NCCL algorithm overhead (e.g., AllReduce paths, redundant transfers) | Reflects real usable performance of the network topology, indicating how efficiently the architecture converts raw bandwidth into useful training throughput. |
4. Layer 3: Key Diagnosis (Who Dominates the System?)
Ask one critical question: Does performance change with message size, or with scale?
✔ A. Message size-driven → GPU issue
Bottleneck is likely:
- GPU compute
- NVLink / PCIe
- NCCL algorithm path
Conclusion: GPU / local communication issue
✔ B. Scale-driven → Network issue
Bottleneck is likely:
- Spine-Leaf / Clos topology
- oversubscription
- ECMP / congestion
- RDMA / RoCE behavior
Conclusion: Network architecture issue
✔ C. Both unstable → System-level issue
Indicates:
- GPU + network dual bottlenecks
- poor architectural design
- incorrect traffic model
Conclusion: System design issue
| Trigger Pattern | Likely Bottleneck | Contributing Factors | Final Conclusion |
| Message size-driven behavior | GPU-side issue | • GPU compute limitations • NVLink / PCIe interconnect bottlenecks • NCCL algorithm path inefficiency | GPU / local communication issue |
| Scale-driven behavior | Network-side issue | • Spine-Leaf / Clos topology limitations • Network oversubscription • ECMP / congestion imbalance • RDMA / RoCE behavior constraints | Network architecture issue |
| Both patterns unstable | System-level issue | • GPU + network dual bottlenecks • Poor architecture design • Incorrect traffic / workload model | System design issue |
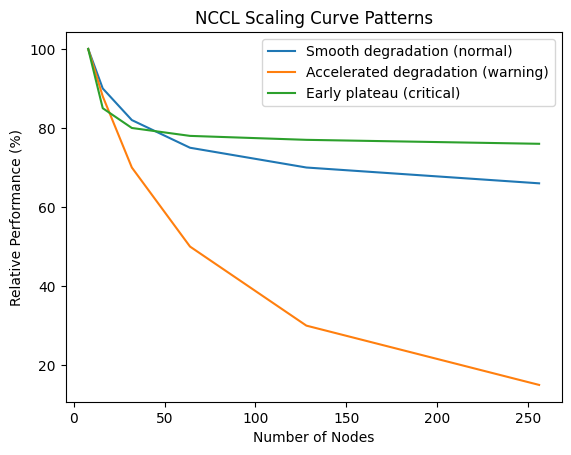
5. Layer 4: Scaling Curve (The Real Divider)
Always analyze:n8 → 16 → 32 → 64 → 128 → 256 nodes
Three patterns to look for
✔ ① Smooth degradation (normal)→ Reflects Healthy system with linear scaling loss
✔ ② Accelerated degradation (warning)→ Reflects Network bottleneck emerging
✔ ③ Early plateau (critical issue) → Reflects System has reached scaling ceiling
Core Insight: Scaling curve = system scalability capability
6. Layer 5: Tail Behavior (What Actually Matters in AI Training)
Do NOT focus on averages. Focus on:
- P95 / P99 latency
- Jitter
- Step time variance
Why this matters: AI training is: a synchronized system, not an average-based system. 99% of GPUs are fast, 1% are slow will cause entire system slows down. Tail spikes dominate global step time.
7. Layer 6: Scale Semantics (Most Important Insight)
Meaning of NCCL across scale: the larger the scale, the less NCCL reflects GPUs and the more it reflects the network.
| Scale | NCCL Represents |
| Small scale | GPU behavior |
| Medium scale | GPU + network interaction |
| Large scale | Network capability |
8. Engineering Checklist (Practical Usage)
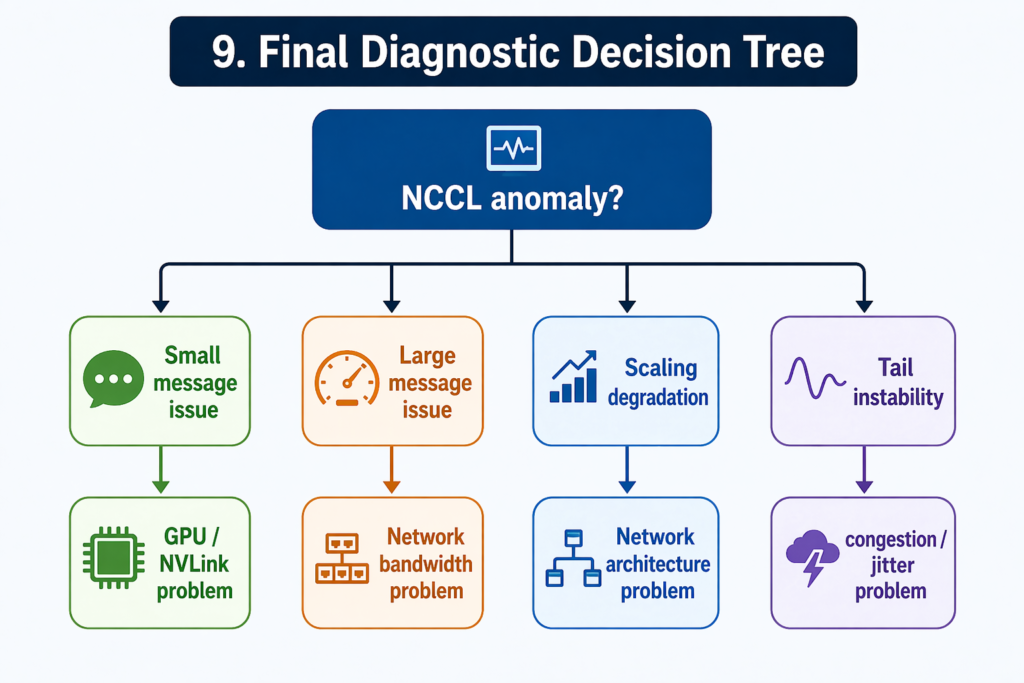
9. Final Diagnostic Decision Tree
10.Final One-Line Summary
NCCL is not a performance report — it is a scale-sensitive system probe that reveals when GPU cooperation begins to break under network constraints.


