Table of Contents
In today’s data centers, which support massive online services such as video streaming, office applications, and financial transactions, the demands on monitoring systems have evolved dramatically. In terms of real-time performance, traffic fluctuations need to be captured on a second-level basis—issues cannot wait to be noticed only after they have escalated. For data visualization, raw traffic numbers must be transformed into intuitive charts rather than just stacked figures. Regarding monitoring metrics, it is not enough to know total traffic; one must also understand its sources, destinations, and associated business attributes—because unseen traffic issues can directly lead to service slowdowns or outages.
To address these requirements, network visibility has become a crucial approach. Below are five core methods for achieving data center network traffic visualization, covering different dimensions and use cases.
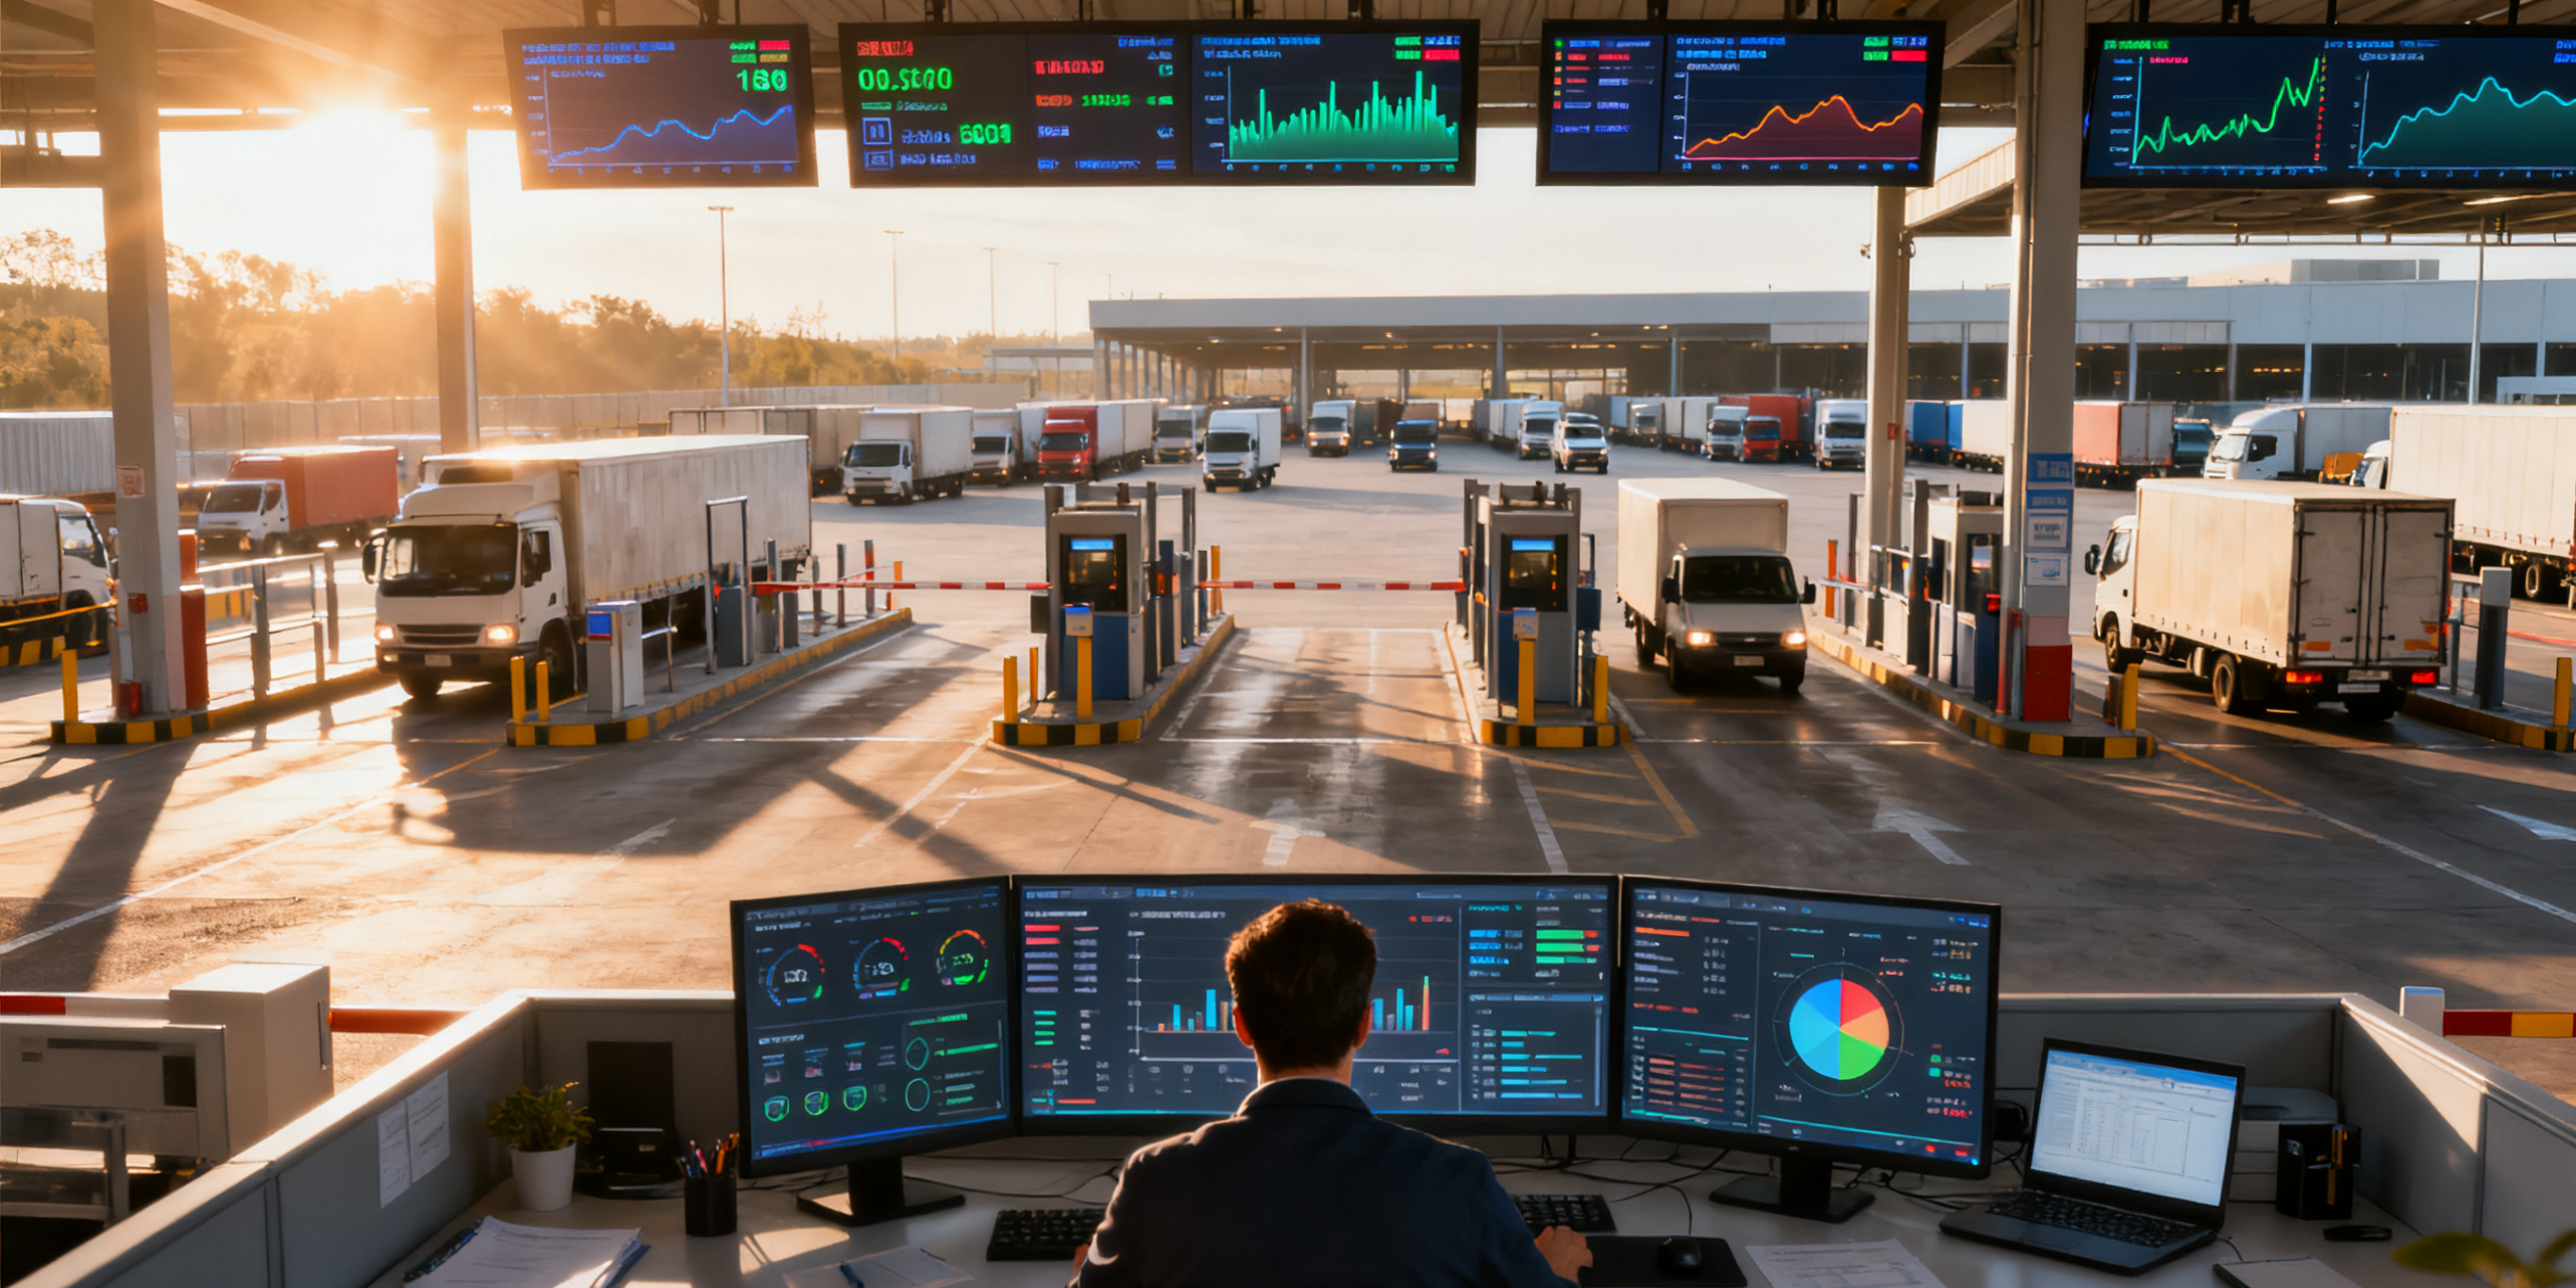
To make these concepts easy to grasp, this article will liken the data center to a “large courier hub” and network traffic to the “delivery trucks” moving through it, using practical examples to explain the five methods of “monitoring the trucks.”
Ⅰ. Traffic Sampling-Based Network Visibility (sFlow / NetFlow / IPFIX)
The first method can be understood as sample-based monitoring. By enabling sFlow or NetFlow protocols on switches or routers, sampled traffic packets are exported to a flow collector and then transmitted to a visualization platform for analysis.
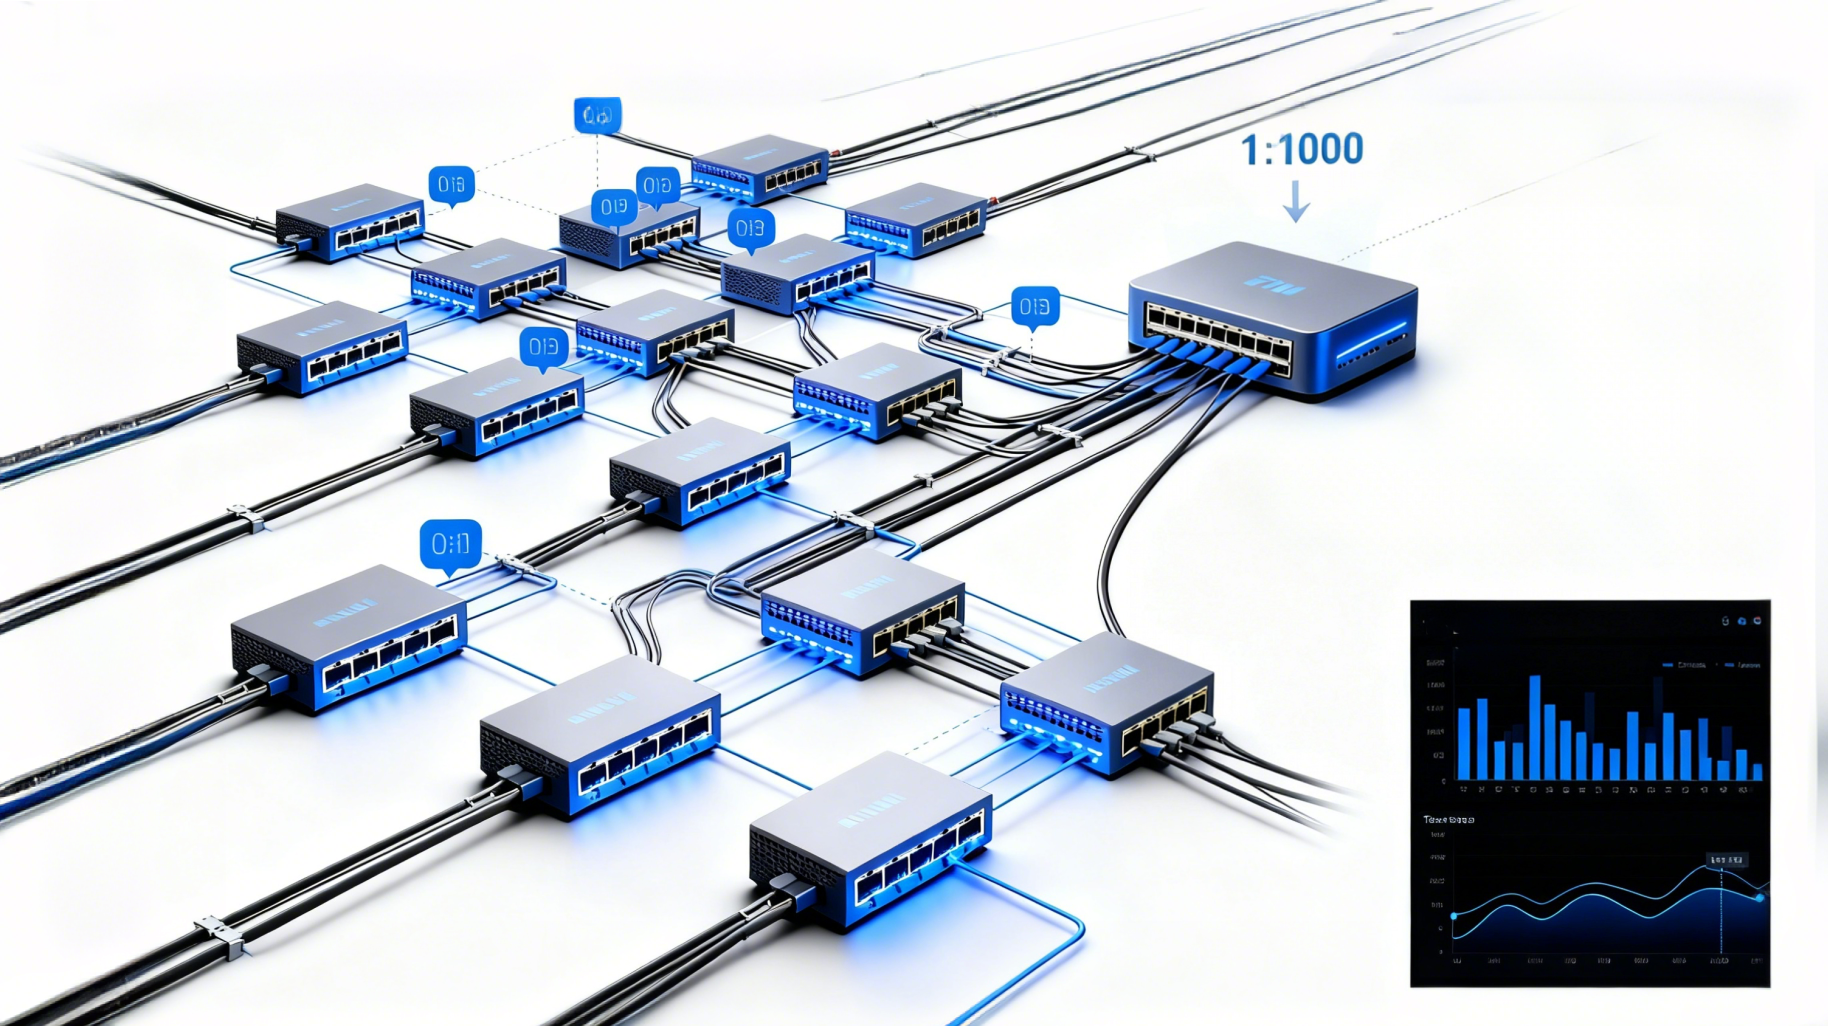
Since sFlow/NetFlow only sample packets and collect metadata, the impact on device performance is minimal. This approach provides a clear view of network-wide traffic trends and allows identification of key metrics such as application ports, five-tuple information, and Top Talkers.
This method is well-suited for macro-level traffic monitoring and capacity planning. Common tools include sFlow-RT, SolarWinds NTA, and Kentik.
Note: “Top Talker” literally means “the most talkative entity”; in networking, it refers to the host, user, or application that generates the most traffic over a given period.
For easier understanding, you can think of it like this: the routers and switches in the data center periodically “sample” a portion of traffic and send it to dedicated tools (e.g., sFlow-RT). Because not all traffic is recorded, the load on the devices is low, making it suitable for observing overall trends—for example, “total traffic this morning is 20% higher than yesterday” or “Server X generated the most traffic.” This way, without heavy effort, you can quickly grasp the general state of network traffic.
Ⅱ. Streaming Telemetry-Based Real-Time Network Visibility
To achieve real-time traffic visualization using this method, the network devices themselves must have telemetry capabilities. It’s like equipping every delivery truck with a GPS: only switches or routers equipped with telemetry can actively record metrics such as bandwidth usage, packet loss, and latency, and push them in real time to a monitoring platform via protocols like gRPC/gNMI or model-driven telemetry.
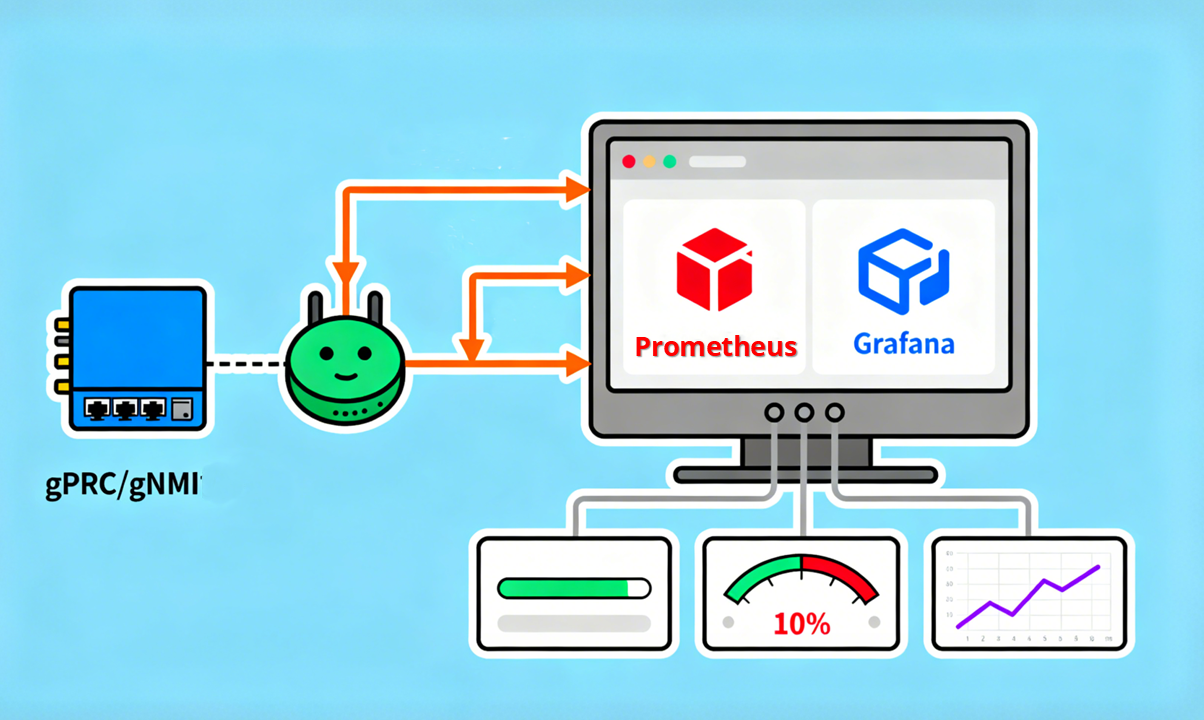
Compared with traditional SNMP polling, this approach does not rely on periodic queries, offering finer-grained data and enabling second-level or even higher-frequency traffic visualization. Typically, devices establish connections to collectors using gRPC or HTTP/2 and continuously transmit metrics according to configured subscription models. These data can then be analyzed and visualized using tools such as Prometheus + Grafana, Juniper HealthBot, or Cisco Crosswork.
In essence, this method allows network devices (routers and switches) to act like vehicles with GPS, actively and continuously reporting traffic metrics—how much bandwidth is used, whether there is packet loss, and current latency—to monitoring tools (e.g., Prometheus + Grafana). Compared to traditional “check every few minutes” methods, this enables near real-time updates, which is crucial in large-scale data centers where even a one-second delay can impact operations.
Ⅲ. Network Visibility Based on Port Mirroring / TAP / NPB
In data center networks, traffic can be captured through Port Mirroring or TAP devices.
Port mirroring is configured within a switch to copy the traffic from specific ports or VLANs to a mirror port, which is then sent to analysis tools or a Network Packet Broker (NPB) for processing. TAP devices are physical devices inserted directly into the link to replicate full traffic to the NPB or analysis platform, with low packet loss risk and minimal impact on the original link.
Regardless of the method, the replicated traffic is usually first processed by the NPB for aggregation, filtering, load balancing, or deduplication, and then sent to traffic analysis platforms for parsing. This allows for deep packet inspection (DPI), application-layer traffic identification, and security visualization.
Common tools include Gigamon, Ixia, Wireshark, Zeek, among others.
This approach essentially installs a “mirror” on network devices (port mirroring) or inserts a “splitter” (TAP) to copy all traffic to analysis tools. Because it captures full traffic, it enables deep inspection, such as determining whether traffic is messaging, video calls, or detecting potentially malicious flows.
Ⅳ.Network Visibility Based on Distributed Probes / SmartNICs
In data center networks, traffic visualization can also be achieved through host-side collection, such as using SmartNICs, DPDK Agents, or distributed probes to capture traffic directly on servers, which is then aggregated to a controller for visualization.
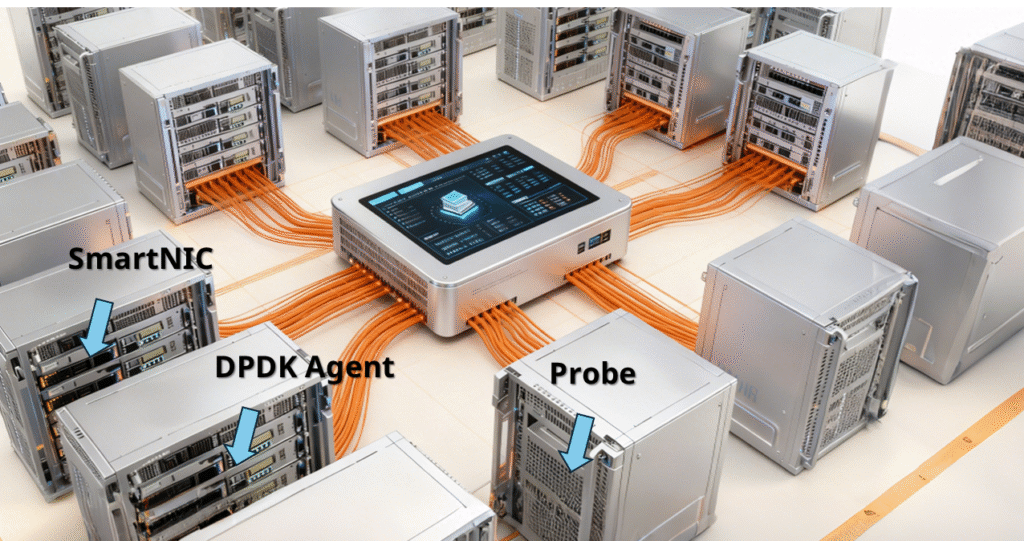
This method allows monitoring at a finer granularity, down to virtual machine or container level, and is particularly suitable for east-west traffic—i.e., traffic flowing between servers horizontally—which is often difficult to capture through traditional network sampling.
Common tools include Cilium Hubble, OVS-DPDK Mirror, Asterfusion Helium SmartNIC, among others.
To put it metaphorically, while previous methods monitor traffic at the “entry points” of the network, host-side collection captures the internal traffic between “small warehouses” (virtual machines or containers). Each host’s traffic is recorded by an agent, documenting how much data flows from one VM/container to another, and then aggregated to the central controller for comprehensive visibility.
Ⅴ. Network Visibility Based on Application Flows / Sessions (Application Flow Mapping)
In data center networks, traffic can also be understood through application flow or session-based visualization, which typically combines L7 logs, distributed tracing (e.g., OpenTelemetry), or application probes. Agents are deployed on application nodes (business servers or containers) to collect data and generate service call graphs and traffic dependency maps.
This method not only shows the volume of traffic, but also clearly indicates who is communicating with whom, providing a direct view of application dependencies and potential bottlenecks.
Common tools include Dynatrace, AppDynamics, Datadog, OpenTelemetry + Jaeger.
To make it concrete: just like an administrator not only wants to know how many delivery trucks pass through a hub but also which e-commerce platform each truck serves — for example, Amazon’s packages first arrive at Sorting Center A, then are transferred by AMZL, and finally delivered to customers. By drawing a business call flow map, the administrator can clearly see traffic and bottlenecks at each stage, allowing rapid identification and resolution of congestion or issues.
The following table provides a clearer, side-by-side comparison of these five methods.
| Method | Technical Principle | Data Source / Deployment | Monitoring Granularity | Applicable Scenarios | Common Tools |
| Traffic Sampling | Enable protocol on switches/routers to export sampled flow packets | Network devices (switches/routers) | Macro traffic trends, 5-tuple, Top Talker | Full-network traffic trend monitoring, capacity planning | sFlow-RT, SolarWinds NTA, Kentik |
| Streaming Telemetry | Network devices push bandwidth, packet loss, latency, etc. in real-time | Network devices (with Telemetry capability) | Sub-second or high-frequency | Real-time monitoring in large-scale data centers | Prometheus + Grafana, Juniper HealthBot, Cisco Crosswork |
| Port Mirroring / TAP / NPB | Mirror ports or TAP devices replicate full traffic, processed by NPB for analysis | Network links or device ports | Full traffic, supports DPI / L7 analysis | Deep traffic analysis, security monitoring, critical link troubleshooting | Gigamon, Ixia, Wireshark, Zeek |
| Distributed Probes / SmartNIC | Host-side traffic collection, aggregated to controller for visualization | Application nodes or servers (VMs/containers) | VM/container-level, east-west traffic | Monitoring east-west traffic between servers, fine-grained analysis | Cilium Hubble, OVS-DPDK Mirror, AsterNOS SmartNIC Telemetry |
| Application Flow / Session Mapping | Collect L7 logs, distributed tracing, or application probes to build call and traffic dependency maps | Application nodes (servers or containers) | Application-level calls and dependencies | Application performance monitoring, business bottleneck analysis | Dynatrace, AppDynamics, Datadog, OpenTelemetry + Jaeger |
Conclusion
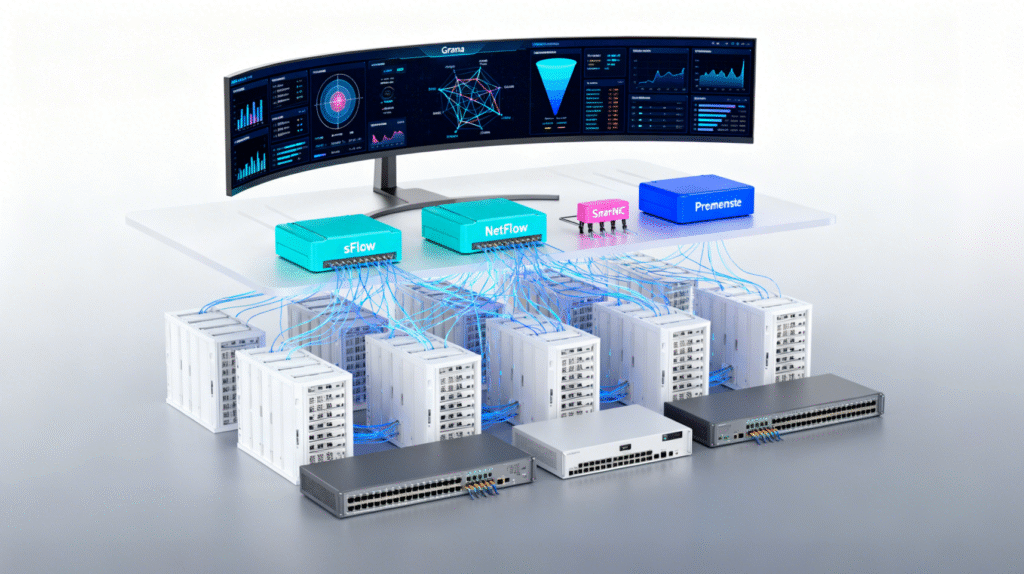
In modern data center environments, network traffic visualization requires a comprehensive approach that considers multiple dimensions, including macro-level traffic monitoring, path tracing, application identification, architectural features, and anomaly analysis. Appropriate toolchains should be selected for different layers—for example, the collection layer can use sFlow/NetFlow or SmartNICs/probes, while the analysis and visualization layer can leverage tools such as Grafana and Prometheus, combined with storage and historical data management to achieve full traffic visibility.
By building such a complete system, operations teams can not only monitor network traffic dynamics in real time and identify anomalies or potential bottlenecks, but also trace faults and optimize resource allocation, supporting efficient operations, capacity planning, and security assurance for large-scale data centers.
In the next article, we will provide a detailed explanation of how Asterfusion implements network visualization.


