Table of Contents
Introduction
Do you know how to perform network stability monitoring? In daily enterprise network operations, do you, as an IT administrator, often encounter a frustrating visibility gap in this scenario:
User complaints keep coming: “Why did WiFi drop again?” “Pages keep spinning and never load.” Yet the network management console shows everything normal: APs online, switch ports operational, bandwidth usage within limits.
Devices are green but user experience is bad. Why disconnect?
Because traditional network monitoring is device-centric and ignores the true arbiter: the terminal or the endpoint user. In today’s digital transformation, endpoint experience is the definitive metric of network quality, making the role of a comprehensive network stability monitor increasingly important.
Endpoint experience is not determined by a single point. It is a fragile chain composed of multiple stages: the wireless air interface, authentication exchanges, IP address assignment, gateway forwarding, and more. A small delay or packet loss at any stage can cascade and produce a poor user experience.
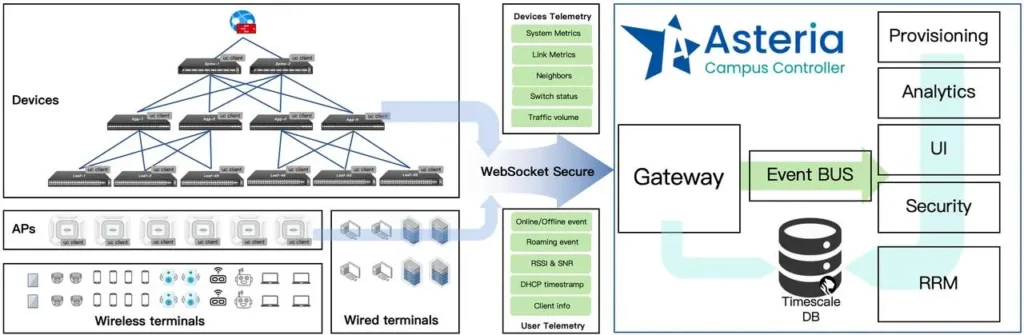
To open this black box, the Asterfusion OpenWiFi Controller introduces a new perspective. By sensing and analyzing end-to-end paths in real time, it quantifies the vague notion of “experience” into seven observable, traceable Key Experience Indicators (KEI) to measure endpoint experience.
Below we examine these seven indicators and show how they perform network stability monitoring and define actual network quality and enable automated tuning.
Ⅰ. Access Success Rate: The First Gate of User Experience
“ I can’t connect to Wi-Fi ”, it is the most basic and often the most critical complaint.
The access success rate measures whether a terminal can establish the physical and link-layer connection without interruption. It appears simple, but there is more beneath the surface. It depends not only on signal coverage but also on each step of the handshake process.
As shown in the figure below, the terminal completes a series of key procedures before it finally joins the network.
Common factors that affect the access success rate include weak RSSI at coverage edges, incorrect password or encryption settings, and an exhausted DHCP address pool.
For example, to check whether the DHCP pool is depleted, you can verify it on the DHCP service page.

By tracking this indicator, IT teams no longer need to guess when users report connection issues. The OpenWiFi Controller provides a clear starting point: confirm whether the terminal has come online, and identify whether the failure occurred during the handshake stage or the address assignment stage.
Ⅱ. Authentication Latency: Balancing Security and Efficiency
In enterprise networks using mechanisms such as 802.1X or portal authentication, establishing the connection is only the first step. Identity verification is a critical stage in the access process.

Authentication latency refers to the time between a terminal initiating an authentication request and obtaining network access. For users, this is the anxious waiting period right after tapping “Connect.”
If the RADIUS server responds slowly or if there is congestion along the path, the terminal may appear connected but still be unable to communicate. By monitoring this metric, the OpenWiFi Controller helps administrators balance security policies with access speed and prevents complex authentication procedures from eroding user experience.
Ⅲ. DHCP Latency: The Speed of Obtaining a Network Identity
Once the terminal completes the physical connection and authentication, it still needs an IP address to obtain a “valid identity” on the network.

DHCP latency directly affects how quickly a terminal comes online.
With full timing analysis of the four-step DHCP exchange (DORA: Discover–Offer–Request–Ack), the OpenWiFi Controller can pinpoint exactly where the delay occurs and identify its root cause.
Whether the issue is relay forwarding congestion or a timeout on the DHCP server, the system makes it clear. With targeted optimization, these delays can be removed, enabling near-instant terminal access.
Ⅳ. Network Reachability: Detecting “False Connectivity”
“Wi-Fi is connected, but I can’t open Google.” This is a typical case of false connectivity. A physical link does not guarantee that services are reachable. The network reachability metric focuses on the success rate of a terminal reaching key service nodes, such as the gateway, DNS servers, or core application servers. By simulating or passively monitoring the terminal’s interactions with these nodes, the OpenWiFi Controller can quickly identify hidden faults such as DNS resolution failures or an unreachable gateway.
For proactive network stability monitoring, this allows the IT team to detect ‘connected but not usable’ issues before users file complaints.
Ⅴ. Throughput and Bandwidth Utilization: Ensure Speed & Stability
This metric reflects a terminal’s data transfer capability and the stability of its uplink and downlink rates. A good experience requires not only high speed but also consistent performance.
In the OpenWiFi Controller, this metric is more than a throughput number — it also guides resource allocation.
Combined with user categories (such as VIP executives or guest users) and service priorities (such as video streaming or file downloads), it forms the basis for dynamic scheduling. It ensures that critical services remain fast and stable during congestion instead of being displaced by large-volume, low-priority traffic.

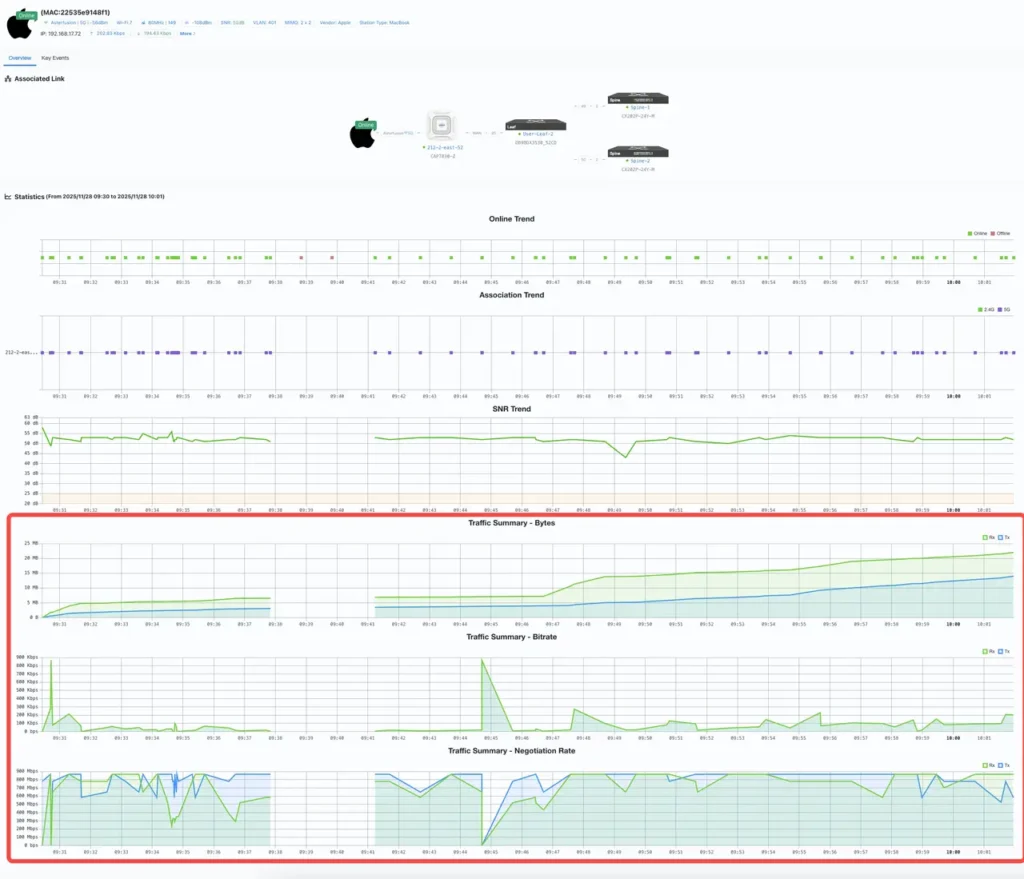
However, even the best scheduling still depends on the health of the physical link.
As shown in the figure, the OpenWiFi Controller presents the terminal’s real-time access rate (Rate) and signal quality (RSSI) in a unified view as the foundation of terminal availability:
- RSSI: reflects the stability of the connection.
- Rate: reflects the physical channel capacity.
With these two parameters, administrators can quickly determine whether a slowdown is caused by bandwidth contention or by the terminal being at the coverage edge with insufficient physical rate.
This multi-dimensional view removes guesswork from bandwidth optimization.
Ⅵ. Latency and Jitter: Evaluating Real-Time Services
With video conferencing platforms such as Zoom and Teams and VoIP services becoming mainstream, it is no longer enough for a network to simply be “reachable” — it must also be smooth.
Latency determines whether conversations feel delayed, while jitter affects audio and video continuity.
To perform network stability monitor, the OpenWiFi Controller does more than check averages. It builds latency distribution curves through continuous sampling to detect experience trends. When the jitter curve shows abnormal spikes, the system can issue early warnings and help prevent important meetings from being disrupted by network quality issues.
Ⅶ. Roaming Success Rate: Enabling Mobility in the Workplace
In modern enterprise campuses, users are free and mobile.
The roaming success rate measures how smoothly a wireless terminal transitions between different APs.

A well-designed wireless network should allow a user to walk from their desk to a meeting room without interrupting a video call or pausing a download.
Functioning as a real-time network stability monitor, the OpenWiFi Controller analyzes the time sequence of each roaming event and calculates the exact duration based on time differences. It identifies whether the handoff was smooth and whether the terminal behaved as a “sticky client” that stays attached to a distant AP with weak signal.
This metric directly affects the continuity and flexibility of mobile work.
Conclusion: From Device Management to Experience Management
The nature of network management is changing. In the past, we focused on device uptime; now, we focus on user satisfaction.
The seven Key Experience Indicators in the OpenWiFi Controller are more than a set of metrics , they represent its core capability in network stability monitoring.
By continuously sensing and analyzing these independent yet interconnected stages, IT teams no longer operate blindly. They gain experience that is observable, traceable, and optimizable.
Free Demo for OpenWiFi Controller
Don’t let hidden network issues undermine productivity. Master these seven elements and ensure every connection is reliable.
If you want to experience these features firsthand, we offer a completely free online demo environment.
👉 Try it here: Asterfusion OpenWiFi Controller
You can log in with Google, GitHub, Microsoft, or Feishu accounts in one click.

Contact US !
- To request a proposal, send an E-Mail to bd@cloudswit.ch
- To receive timely and relevant information from Asterfusion, sign up at AsterNOS Community Portal
- To submit a case, visit Support Portal
- To find user manuals for a specific command or scenario, access AsterNOS Documentation
- To find a product or product family, visit Asterfusion-cloudswit.ch


