Table of Contents
Introduction
In data center and enterprise network operations, teams often face common issues: link utilization alerts trigger frequently without clarity on which traffic is consuming bandwidth; users experience lag or disconnections in video conferences; and new services may cause fluctuations on individual interfaces despite stable overall traffic.

Traditional logs and monitoring tools only show basic device status, like interface activity or total traffic, and cannot reveal which host is consuming bandwidth. sFlow in SONiC uses packet sampling and interface statistics to provide operators with a clear, measurable view of network traffic, helping them analyze and pinpoint issues.
Ⅰ. How sFlow Works
Our Asterfusion devices, which support sFlow, are listed on the sFlow official website.
The idea behind sFlow is simple: by sampling traffic and interface statistics and sending them to a Collector, network operators can gain a global view at low cost.
Its implementation can be roughly divided into two steps:
1. Sampling
- Counter sampling: Focuses on the health of the interface itself, such as port speed, packet loss, and error frames.
- Flow sampling: Focuses on the traffic passing through the interface, capturing information like source/destination IPs, ports, and protocols through random packet sampling. In short, one monitors “interface status,” the other monitors the “flows through the interface.”
2. Reporting
Inside the switch, there is an embedded sFlow agent. This agent collects Counter data and Flow data based on a predefined sflow sampling rate (for Flow data) or a sampling interval t (for Counter data). The collected data is packaged into the Datagram field of sFlow packets and forwarded via UDP (default port 6343) to a remote sFlow Collector. The Collector can display traffic for a single device, aggregate data from multiple devices, and visualize traffic trends, providing the data support needed for network monitoring.
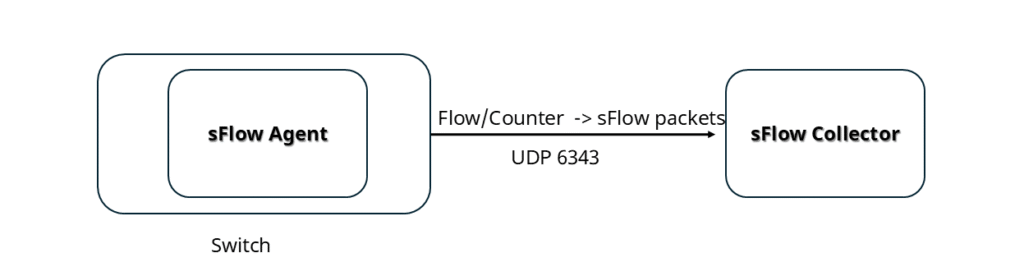
In one sentence, sFlow is “lightweight sampling + centralized analysis,” trading minimal overhead for clear, global traffic visibility.
Note: On Asterfusion CX-N series switches , the default sflow sampling rate is 10,000, which can be adjusted according to actual needs.
Ⅱ. Role-Based Benefits of sFlow in SONiC
After deploying sFlow in the network, it delivers tangible benefits for different roles.
For network administrators, the typical scenario used to be: “A link has been running at 90%+ utilization for a long time, with alerts constantly firing. Traditional tools can only tell you the link is full, but not which traffic is causing it. Administrators either have to log into devices and capture packets or check each interface manually—an inefficient process.”
With sFlow, the Collector report instantly shows that 60% of the traffic comes from the backup servers of the R&D department, and another 20% is cross-data-center replication. Administrators can immediately identify the issue, reducing troubleshooting time from hours to minutes.
For operations engineers, when business teams complain about frequent video conference lag, the first instinct is often: “The network is the problem.” Without granular data, it’s hard to clarify responsibility. sFlow’s Flow sampling data, however, can show that during peak hours, video traffic accounts for only 5% of the link, while the real “heavy users” are database synchronization and nighttime backups. This allows operations teams to present objective data to the business, avoiding blame and improving communication.
Ⅲ. Why Choose sFlow in SONiC Over NetFlow or SNMP
Some may ask: “What about NetFlow or SNMP? Don’t these traditional tools already serve the monitoring purpose?”
In terms of resource usage, NetFlow typically requires maintaining flow tables on the device, consuming CPU and memory. sFlow in SONiC, on the other hand, uses sampling, is stateless, and much lighter. Its reporting interval is short, and the protocol is simple, making it widely supported by vendors.
Compared to SNMP, which can only tell you that a physical port has a total traffic of 100 Mbps—like saying “this highway is congested” without knowing which vehicles are causing it—sFlow not only indicates congestion but also reveals the details: for example, 10 large trucks (a specific IP) and a marathon (a type of application) are responsible. It provides granular visibility into traffic, including IPs, applications, and conversations, whereas SNMP only provides the total port volume.
You can get an overview through the table below:
| Feature | SNMP | NetFlow | sFlow |
|---|---|---|---|
| Collection Method | Polling (Pull) | Flow table statistics (Flow-based) | Random sampling (Sampling) |
| Data Granularity | Port totals (overall traffic) | Full session information (source/destination IP, port, protocol) | Flow sampling + port counters (partial traffic details) |
| Real-time Capability | Low | Medium | High |
| Resource Usage | Very low | High (maintaining flow tables) | Low (stateless sampling) |
| Use Cases | Basic traffic monitoring, device status | Traffic analysis, session tracking | Large-scale real-time monitoring, traffic analysis, interface health monitoring |
| Vendor Support | Widely supported | Broad | Widely supported |
| Advantages | Simple, low overhead | Provides detailed session-level traffic | Efficient, lightweight, supports detailed flow analysis |
| Limitations | Coarse granularity, lacks application/session details | High resource consumption, not ideal for large-scale real-time monitoring | Statistical data only, not complete traffic information |
Ⅳ. sFlow Deployment
The diagram below shows a typical sFlow network topology:
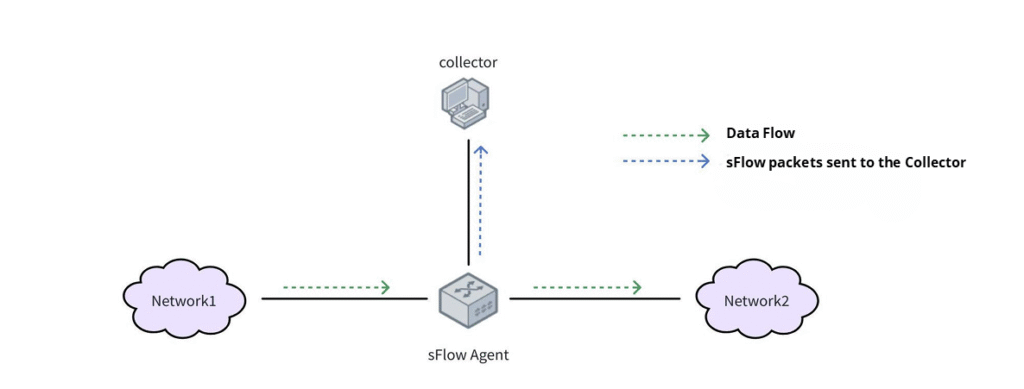
Deploying sFlow in SONiC is extremely simple, as most modern switches and routers come with built-in sFlow agent functionality. The steps are as follows:
- Configure the network device: Enable the sFlow service on the sFlow Agent and set an appropriate sampling rate or sampling interval.
- Set the Collector IP on the device and ensure the Agent can communicate with the Collector.
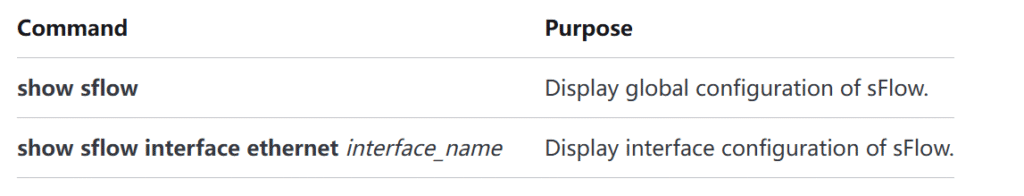
- Monitor on the Collector: Listen for sFlow packets on UDP port 6343. Once packets are received, visualization tools can display the sFlow packet types and contents. Administrators can also use the command “
show sflow” to check the configuration directly. - Analyze traffic: Counter-type packets indicate the volume of traffic passing through each sflow port, while Flow-type packets carry Datagram fields that show sampled traffic snippets.
On Asterfusion CX-M campus series and CX-N data center series switches, sFlow is enabled by default. Administrators only need to complete the steps above to activate it—no extra hardware or complex configuration is required.
For additional commands, see the sFlow Command Line Reference.
Ⅴ. Simplify Network Monitoring with sFlow in SONiC
In today’s complex network environments, sFlow with SONiC opens a “traffic window” for operations teams. Through Counter and Flow sampling, administrators can perform sflow monitoring of both interface health and traffic composition. With the coordination between the sFlow agent and Collector, traffic data is quickly aggregated into actionable insights.
For different roles, it serves as a troubleshooting tool for administrators, a persuasive tool for operations staff, and a decision-making reference for business teams. The next time you face network issues, sFlow may be the most lightweight and direct solution.
Finally, let’s go over a few basic questions:
1. sFlow vs NetFlow vs IPFIX
sFlow: Uses packet sampling plus interface counters; it is lightweight, stateless, and reports via UDP, making it suitable for large-scale real-time monitoring.
NetFlow/IPFIX: Based on flow tables, records complete session information; it is stateful and reports via TCP/UDP (NetFlow v9/IPFIX), with higher overhead, suitable for detailed traffic analysis.
2. sFlow vs JFlow
JFlow is Juniper’s implementation of NetFlow and functions similarly to NetFlow.
sFlow is lighter, based on sampling, and does not maintain full flow tables.
3. Does sFlow use TCP or UDP?
sFlow uses UDP (default port 6343), which is lightweight and connectionless; packet loss has minimal impact on statistical accuracy.

Contact US !
- To receive timely and relevant information from Asterfusion, sign up at AsterNOS Community Portal
- To submit a case, visit Support Portal.
- To find user manuals for a specific command or scenario, access AsterNOS Documentation
- To find a product or product family, visit Asterfusion-cloudswit.ch .
- To contact Sales, Send E-Mail to bd@cloudswit.ch


