Table of Contents
Introduction
With the development of cloud networks and AI data centers, network monitoring systems are facing higher demands for real-time performance, visualization capabilities, and comprehensive metrics. Let’s see how the Prometheus Exporter helps meet these requirements.
In AIDC scenarios, Ethernet carries the RDMA protocol, evolving into RoCEv2 technology. However, traditional Ethernet methods such as SNMP struggle to provide high-precision, low-latency monitoring of RoCE traffic, either requiring extensive development or delivering insufficient accuracy.
To address this, Asterfusion has introduced the AsterNOS Exporter + Prometheus + Grafana monitoring and alerting solution. By combining the Prometheus Exporter for SONiC with the Grafana platform, it enables more efficient, precise, and comprehensive data collection, monitoring, and visualization.
Next, let’s take a look at how this solution works.
Ⅰ. Basic Concepts for AsterNOS exporter for SONiC and Prometheus&Grafana
To better understand this solution, let’s first clarify a few key concepts:
1. Two types of traffic
TCP/UDP traffic: Focuses on basic connectivity—essentially “does the network work?” It relies on TCP (reliable transmission, congestion control, ensures data integrity) or UDP (fast, low latency, tolerates some packet loss). CPU and the OS kernel are involved in processing, making it suitable for general-purpose applications such as web browsing, file transfer, and video streaming.
RoCEv2 traffic: Focuses on transmission quality—essentially “how well does the network perform?” It is based on RDMA (Remote Direct Memory Access) technology and encapsulated in UDP/IP, bypassing the CPU and OS kernel. The RNIC (RDMA Network Interface Card) enables direct memory-to-memory access between devices. This type of traffic is used in high-performance computing, distributed storage, and other scenarios where latency and throughput are critical.
2. Two types of encapsulation
TCP/UDP traffic encapsulation: Follows the full TCP/IP protocol stack, with data passing through all seven OSI layers. Each layer requires CPU and memory involvement. The transmission path follows the traditional route: Application → Kernel → NIC. This path primarily serves general-purpose TCP/UDP applications.
RoCEv2 traffic encapsulation: Core RDMA data (such as memory addresses and operation commands) is encapsulated within UDP/IP frames and sent over specific UDP ports to identify RoCE traffic, allowing network devices to recognize this specialized traffic. The transmission path is Application → RNIC (via RDMA verbs) → RNIC hardware encapsulates data into UDP/IP → NIC sends packets, providing low-latency, high-throughput performance.
3. Two types of tools
Packet capture tools: Primarily used to capture and analyze TCP/UDP traffic. They can record TCP frames, UDP frames, and the corresponding IP packets on the network. However, they have a significant limitation: they cannot parse the RDMA protocol headers within the UDP payload of RoCEv2 traffic. These headers are specific to RNICs and are outside the scope of standard TCP/IP protocol parsing, making deep analysis of RoCEv2 traffic impossible with ordinary packet capture tools.
RDMA tools: Designed specifically for RoCEv2 traffic. They can parse RDMA headers within UDP payloads and read internal counters on RNICs, which track key metrics such as PFC triggers, ECN marks, RDMA transaction success/failure, and queue packet counts. These metrics allow operators to accurately determine whether RoCEv2 traffic is congested, if RDMA interactions are functioning correctly, and whether the RNIC is operating stably.
4. Two key RDMA metrics
PFC (Priority Flow Control): A “post-event correction” mechanism to prevent packet loss. When a specific RoCEv2 traffic priority experiences congestion (e.g., downstream buffers nearly full), the downstream device sends a pause frame to stop upstream transmission. Once the buffer clears, a resume frame is sent to continue transmission, avoiding packet loss. Monitoring focuses on the frequency of pause/resume frames and whether long-term pauses occur.
ECN (Explicit Congestion Notification): A “preemptive warning” mechanism to prevent congestion. When a switch detects that its buffer is approaching a threshold (but not yet congested), it marks IP packets with ECN flags (in the DS field of the IP header, formerly the ToS field). The receiver reports this to the sender, which proactively reduces its sending rate to relieve congestion at the source. Monitoring focuses on the proportion of ECN-marked packets and whether the sender adjusts its rate promptly.
Ⅱ. How AsterNOS Exporter Excels with Prometheus & Grafana
Unlike standard exporters, AsterNOS Exporter provides users with richer data sources and finer-grained monitoring metrics, with data sampling precision reaching sub-second levels.
For cloud networking scenarios, the Prometheus Exporter for SONiC offers protocol status information including BGP, OSPF, MC-LAG, and EVPN, enabling users to more easily monitor both Overlay and Underlay networks within the data center.
For high-performance computing scenarios, it provides RoCE-related information such as configuration details, queue packet counts, PFC counts, ECN counts, and interface buffer utilization, helping users quickly detect anomalies in RoCE networks and pinpoint the root causes of issues.
Deployment is simple and efficient. Users can leverage the provided Prometheus and Grafana configuration templates, import them into the corresponding monitoring platforms, and complete device monitoring setup and visualization with minimal learning curve and effort, greatly improving deployment efficiency.
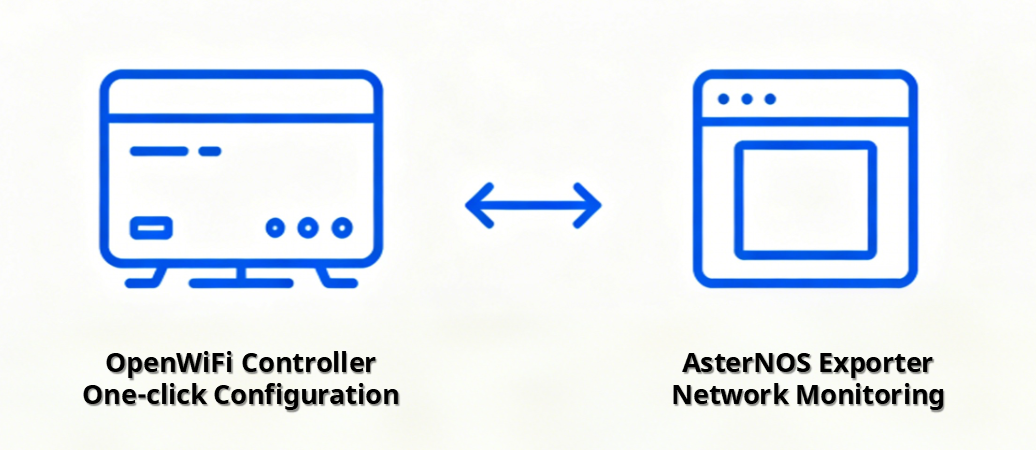
Additionally, this solution can work in conjunction with the Open WiFi Controller: the Open WiFi Controller enables one-click configuration of network devices and real-time network status monitoring, while SONiC-based Prometheus Exporter focuses on monitoring network traffic and performance, providing a complete solution for configuration and real-time network visibility.
Ⅲ. SONiC-based Prometheus Exporter: How the Solution Works
1. Components
This solution consists of three key components:
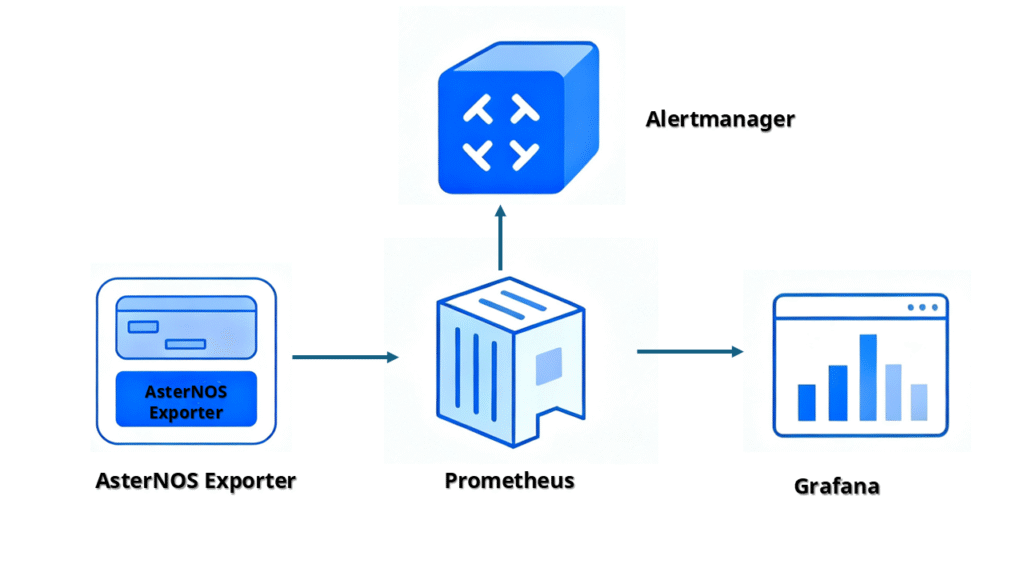
First, AsterNOS Exporter is a lightweight HTTP-based monitoring component that runs as a container on the AsterNOS operating system. It converts monitoring data that is not in Prometheus format into Prometheus-compatible metrics, allowing Prometheus to periodically pull and store the data.
The second component is Prometheus, an open-source time-series monitoring and alerting system. It serves as the data collector and storage engine within the monitoring stack, offering powerful capabilities for data collection, storage, and querying. Prometheus supports multiple exporters and can handle clusters with tens of thousands of devices. Its Alertmanager component receives alerts generated by Prometheus and executes notifications according to configured rules.
The third component is Grafana, an open-source data analysis and visualization platform designed for time-series data. Grafana does not store data itself; instead, it connects to Prometheus (or other data sources) to render metrics as visual charts, such as line graphs or bar charts, providing clear and intuitive visualizations.
In short, AsterNOS Exporter exports time-series data from network devices, Prometheus stores and manages this data as queryable time-series databases, and Alertmanager triggers alerts based on predefined rules. Grafana, tightly integrated with Prometheus, retrieves the metrics and provides clear, visual representations for easy monitoring.
Next, let’s take a look at the detailed workflow. The diagram will make it straightforward to understand.
2. How It Works
Let’s use this diagram to understand the interaction between the Prometheus exporter and Grafana.
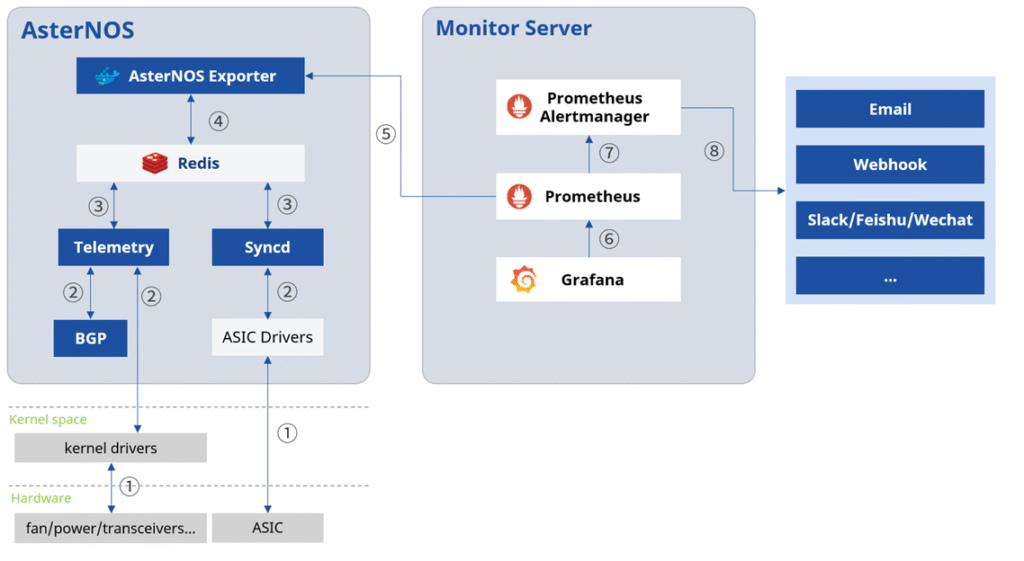
Switch Side:
① Kernel and ASIC Interaction: The kernel driver collects the status of external devices, while the ASIC drivers communicate with the ASIC to periodically read the registers that store performance counters and statistics.
② Data Collection:
- The Telemetry container gathers control plane and system health data, including routing protocol states (e.g., BGP, OSPF) from the BGP container, and device status metrics (e.g., power status, CPU usage) from the kernel.
- The Syncd container collects data plane and hardware performance metrics, retrieving interface counters and other statistics from the ASIC driver via the SAI API.
③ Data Storage: Telemetry and Syncd write the collected metrics in ② into the Redis database.
④ Exporter Exposure: Once the AsterNOS Exporter is enabled, it periodically reads the metrics from the database, formats them into Prometheus-compatible metrics, and exposes them via the configured HTTP endpoint.
Monitoring Platform Side:
⑤ In the Prometheus configuration, add the corresponding HTTP endpoint and edit the configuration file so that Prometheus can periodically scrape metrics from the AsterNOS Exporter.
⑥ In Grafana, configure the data source as Prometheus and import the AsterNOS Dashboard configuration file to visualize the metrics retrieved from Prometheus according to the predefined format.
⑦ Prometheus sends alert data to the Alertmanager component based on user-defined alerting rules.
⑧ The Alertmanager receives the alert data and delivers notifications via email or other configured channels.
By following the diagram and arrow directions, the workflow can be easily understood.
Note: The direction of the arrows indicates which component triggers the activity.
Ⅳ. SONiC-based Prometheus Exporter: Deployment Scenarios
There are two typical application scenarios, along with alerting examples.
1. Cloud Network Scenario
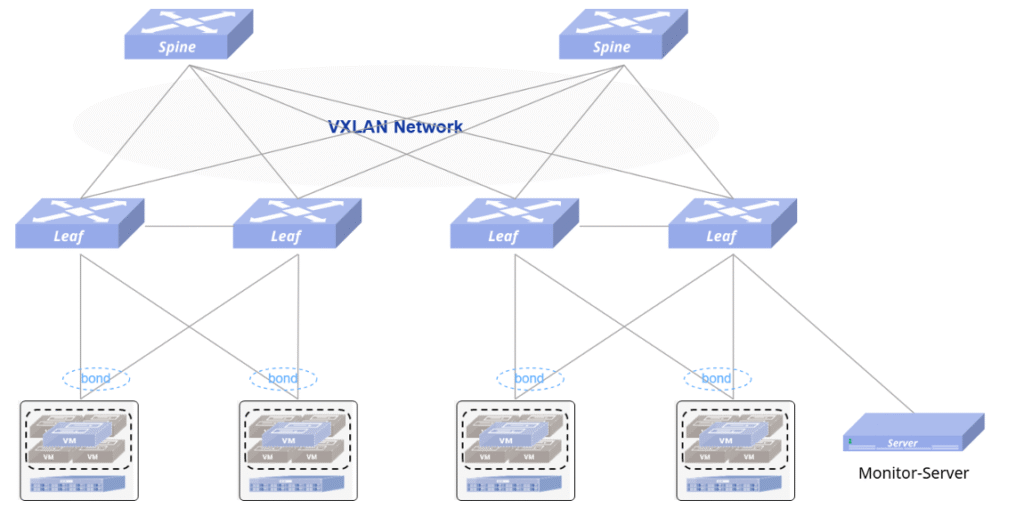
The figure below illustrates a typical cloud computing network deployment. Asterfusion CX564P-N switches are used as spines, and CX308P-48Y-N-V2 switches as leaves. This network setup supports high-speed RoCEv2 traffic monitoring and, when combined with the Prometheus exporter for SONiC, enables full-link, sub-second metric collection.
Additionally, the deployment leverages an EVPN MC-LAG dual-homing VXLAN distributed gateway solution, taking advantage of both EVPN and MC-LAG technologies to provide highly reliable access, load balancing, fault tolerance, and independent upgrades. By deploying a monitoring server within the network, both Underlay and Overlay network statuses can be closely monitored.
The following shows some example monitoring information:
Device Operational Status
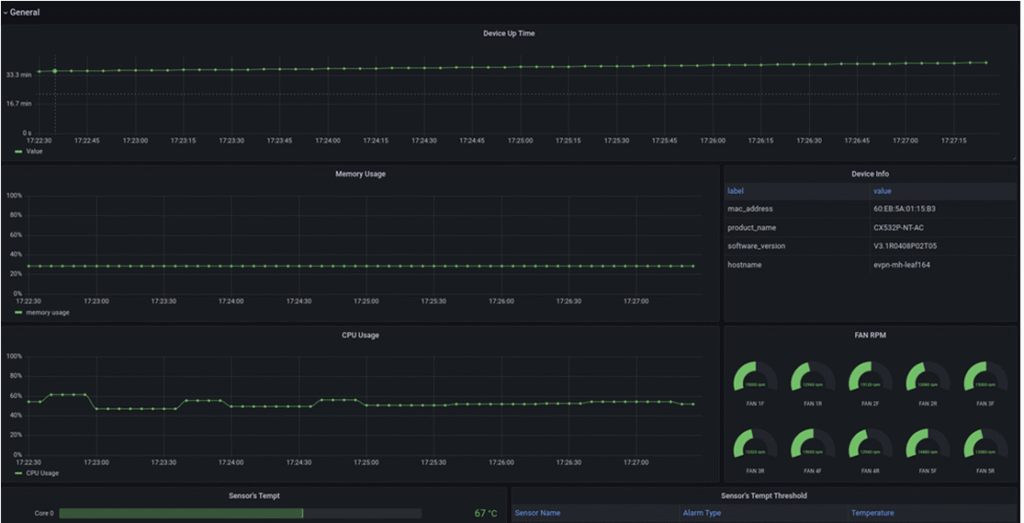
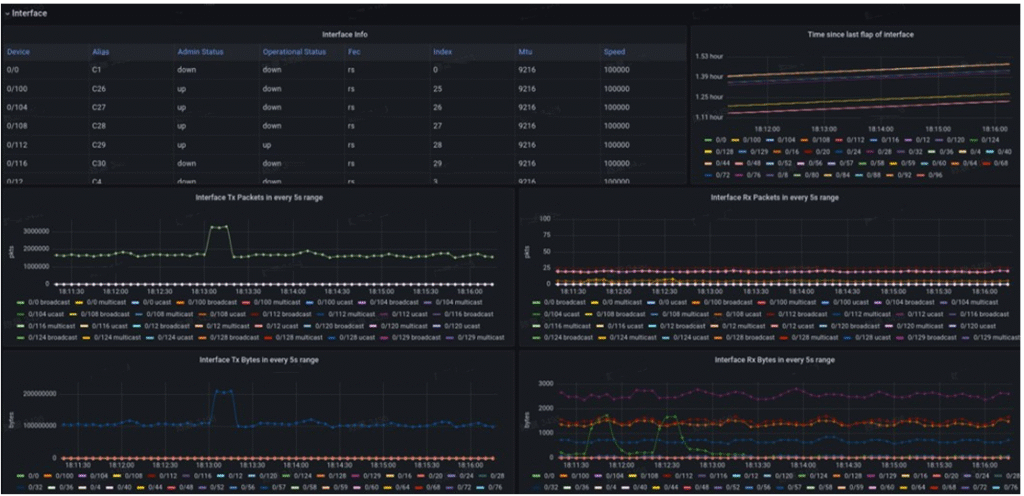
Interface Traffic Forwarding
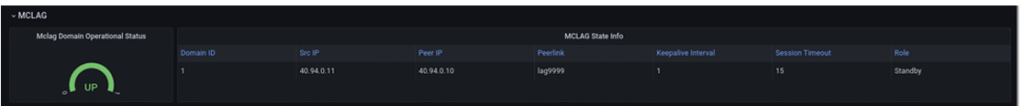
MC-LAG Status Monitoring
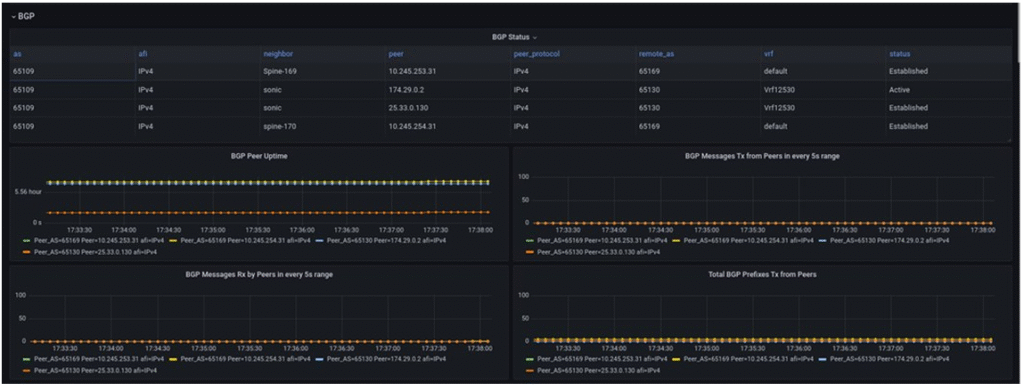
BGP Status
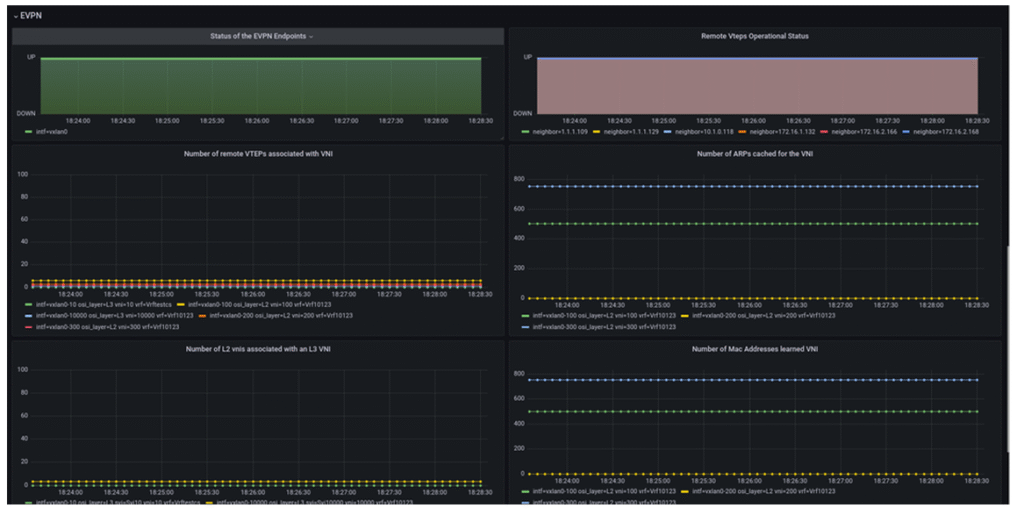
EVPN Status
2. AIDC Scenario
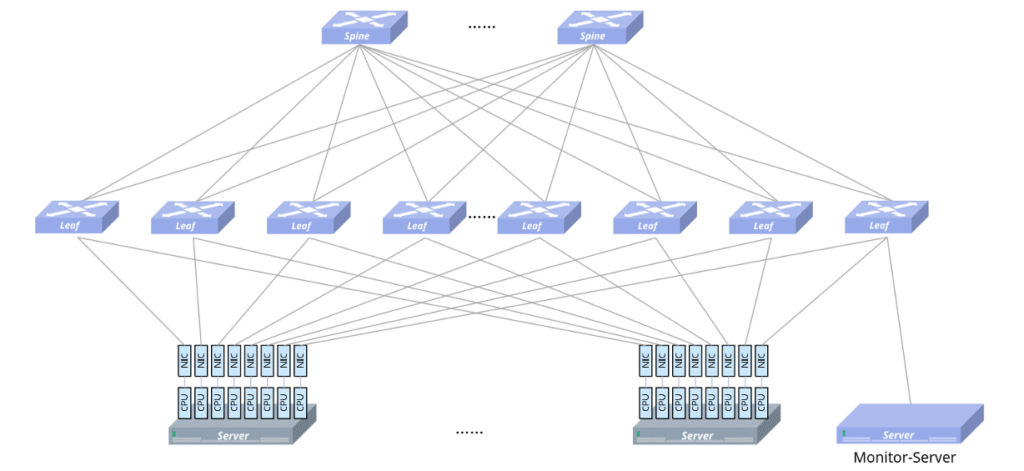
Modern data center construction is evolving toward larger scale, higher computing power, lower energy consumption, and easier operation and maintenance, particularly in next-generation data centers such as supercomputing centers and intelligent computing centers. AI data centers provide high-performance computing with ultra-high bandwidth, low latency, and high throughput to support large-scale model training.
As shown in the figure below, in an AIDC network, the CX864E-N acts as the spine, the CX732Q-N acts as the leaf, and a monitoring server is deployed to provide centralized management and monitoring of all switches, simplifying operations and maintenance.
The following shows partial monitoring information:
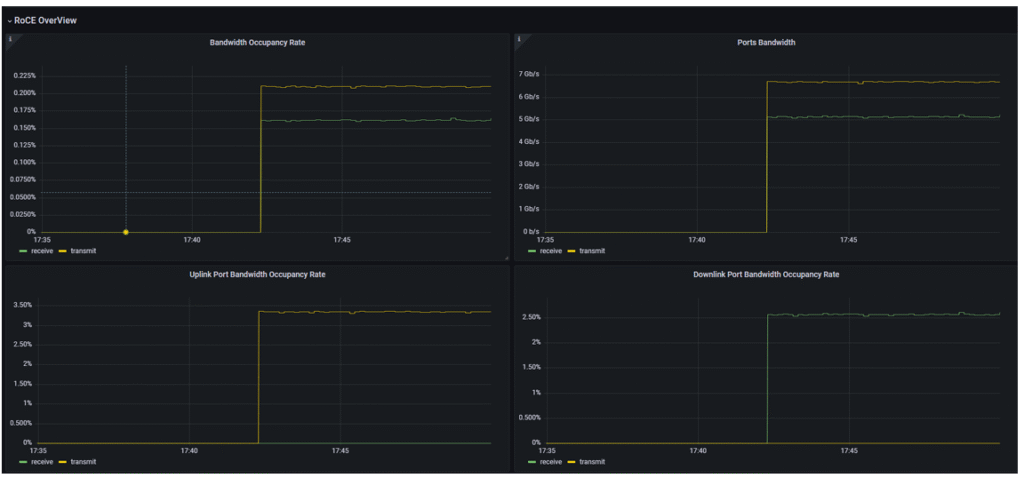
RoCE Overview
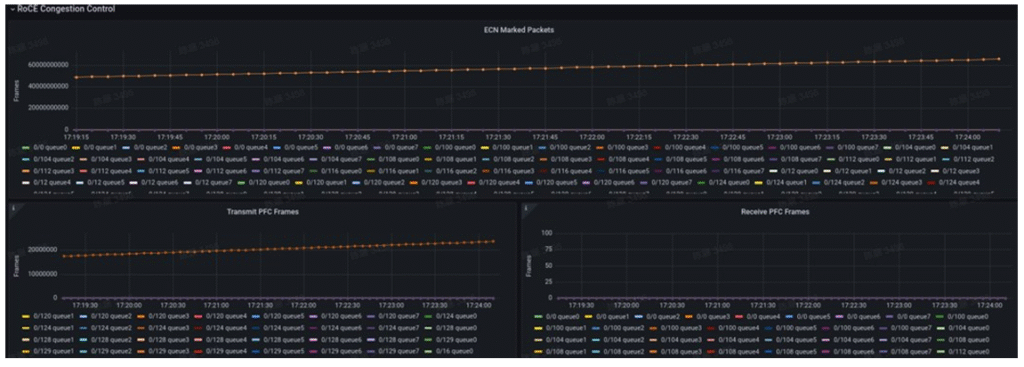
PFC/ECN Statistics
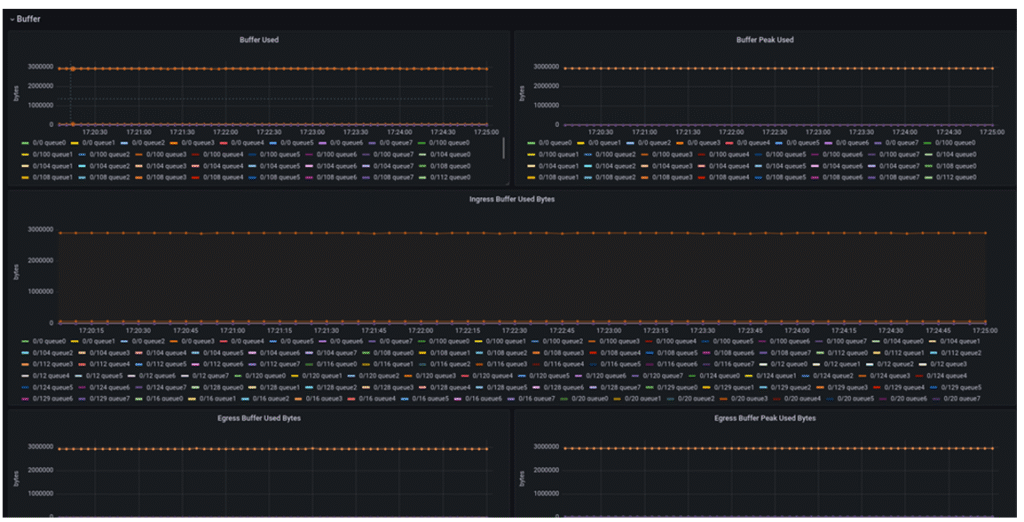
Buffer Utilization
3. Alarms
Alarms help operations engineers promptly detect anomalies, provide early warnings of potential failures, and identify root causes to ensure stable device operation. Users can import Asterfusion’s alarm rule templates or configure custom alarm rules according to actual requirements.
The following is a common alarm example:
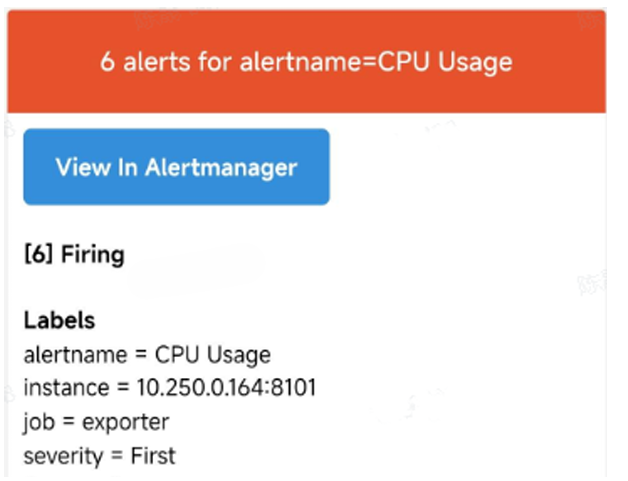
An alarm is triggered when a device’s CPU usage remains continuously above the user-defined threshold.
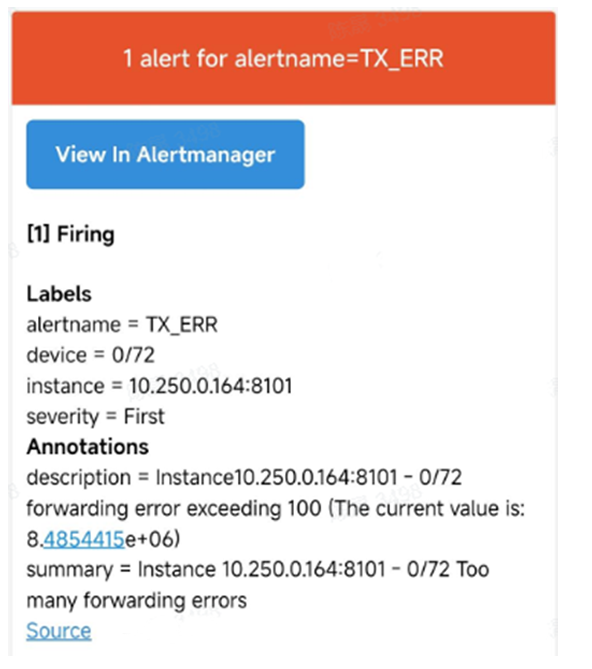
An alarm is triggered when the average packet error rate on a device interface exceeds the user-defined threshold.
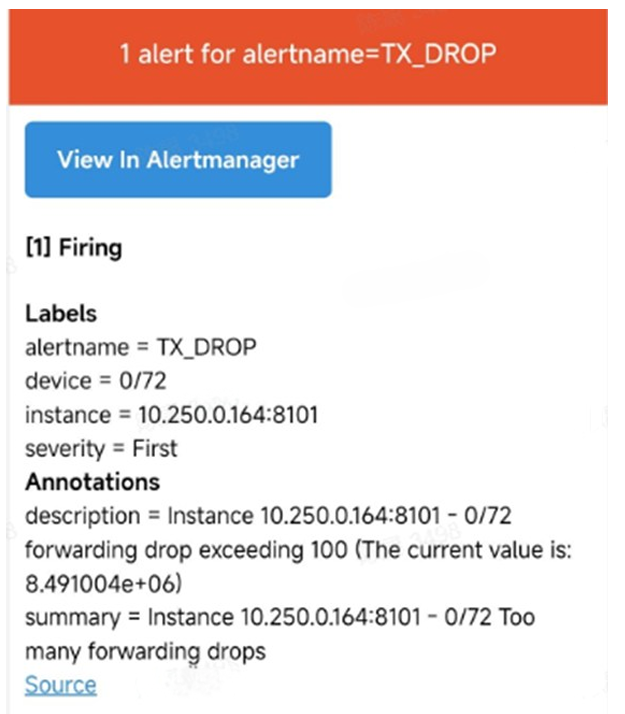
An alarm is triggered when the average outbound packet loss rate on a device interface exceeds the user-defined threshold.
Ⅴ. Conclusion
With the visualization and alarm solution based on AsterNOS Exporter + Prometheus + Grafana, users can achieve comprehensive, second-level monitoring of network traffic and device status in both cloud network and AIDC scenarios, while precisely collecting and triggering alarms on key metrics such as RDMA and RoCEv2.
Our data center product line natively supports this monitoring solution, allowing users to deploy it directly for real-time traffic visualization and alerting.
This solution transforms complex network data into intuitive visual charts, enabling operations teams to quickly identify anomalies, locate faults, and optimize resource allocation, significantly improving the operational efficiency, reliability, and controllability of the data center.
With its simple and efficient deployment, rich monitoring dimensions, and flexible alarm mechanisms, Asterfusion’s solution truly delivers a “faster, better, and superior” network visualization and operations experience, making the management of complex cloud and intelligent computing networks straightforward and controllable.
The traffic metrics we collect can be referenced in the datasheet or contact us for more details.