Network monitoring is an important part of a network management strategy and can provide valuable information to understand network-related issues that may affect an organisation. Regular monitoring of the network reduces the risk of network overload, router problems, downtime, cybercrime and data loss.
Table of Contents
What are the popular open source network monitoring tools?
| Tool | Description | Key Features |
|---|---|---|
| Cacti | A graphing solution that works alongside RRDTool to collect performance data in LANs. | – Simple Network Management Protocol (SNMP) support – Graphs traffic data – Templates for easy setup – MySQL database for data storage |
| Nagios Core | A popular monitoring tool with extensibility and a user-friendly interface. | – Auto-discovery of devices – Sophisticated performance graphs – Customization through add-ons – PHP web interface (Nagios V-Shell) – RESTful API |
| Icinga 2 | A flexible tool that builds on Nagios Core and offers customizable dashboards and excellent visualization capabilities. | – RESTful API for custom configurations – Live performance data monitoring – Native support for Graphite and InfluxDB – Alerts and notifications via email or text |
| Zabbix | A comprehensive monitoring tool that covers network, server, cloud, application, and service monitoring. | – Network bandwidth usage tracking – Network health and configuration change monitoring – SNMP, IPMI, and IPv6 support – Templates for easy device discovery – Alerts and notifications – Wide range of supported platforms |
| Prometheus | A popular tool for monitoring time-series data with a large community following. | – Time-series data monitoring – Alertmanager for event notifications – Integration with various data sources (Docker, StatsD, JMX) – Grafana integration for visualization |
What is Prometheus do?
Prometheus is a free software that helps monitor and send alerts about computer systems. It has been around since 2012 and has become really popular among companies and organizations. Lots of developers and users actively contribute to it. It’s not owned by any particular company and is managed by a community of people who work on it together. In 2016, Prometheus became part of the Cloud Native Computing Foundation.
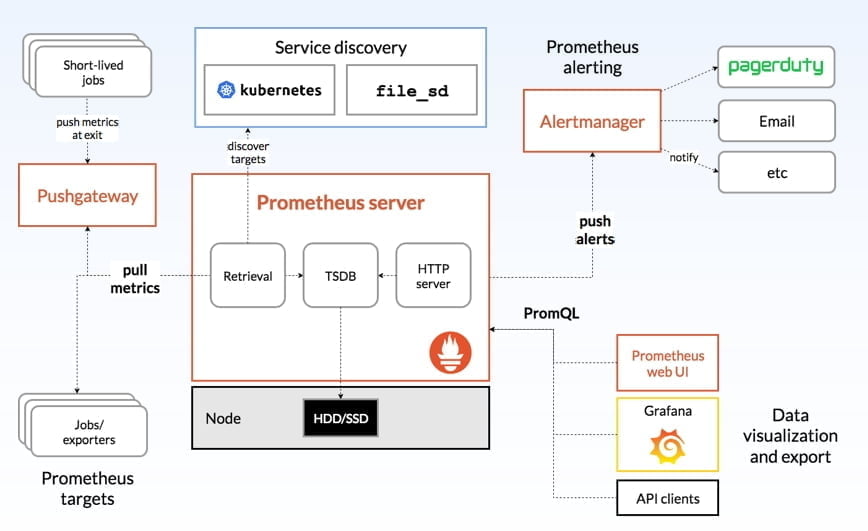
- Prometheus Server: For data collection and storage, PromQL queries, alarm configuration.
- Push gateway: The master node for reporting batch and short-term monitoring data.
- Exporters: Various exporters for reporting data, such as node_exporter for reporting machine data, MongoDB_exporter for reporting MondogDB information, etc.
- Alertmanager: For advanced notification management.
Exporters for Collecting Data
To collect monitoring data from a target (host or service), you first have to install a collection component on the target being collected, which is called an exporter. There are lots of exporter on their official website: http://prometheus.io
- Consul exporter (official)
- Memcached exporter (official)
- MySQL server exporter (official)
- Node/system metrics exporter (official)
- HAProxy exporter (official)
- RabbitMQ exporter
- Grok exporter
- InfluxDB exporter (official)
These exporters can collect monitoring data from the target for us and transmit it to Prometheus. At this point, the exporter exposes an http interface and Prometheus periodically pulls the appropriate data using Pull over the HTTP protocol.
However, Prometheus also provides Push mode for data transfer, which is implemented by adding Push Gateway as a middleman, where you can push data to the Push Gateway, and Prometheus then fetches the data from the Push Gateway via Pull.
This is why you can see two Pull metrics from the architecture diagram, one is the collector directly by the Server to pull data (pull); the other is the collector actively Push data to the Push Gateway, Server and then on the Push Gateway actively pull data (pull).
The main process of collecting data is as follows:
- Prometheus server periodically pulls data from statically configured hosts or service-discovered targets (zookeeper, consul, DNS SRV Lookup, etc.)
- when the newly pulled data is larger than the configured memory buffer, Prometheus persists the data to disk, or remotely to the cloud.
- Prometheus presents data through PromQL, API, Console and other visualization components such as Grafana, Promdash.
- Prometheus can configure rules and then query the data at regular intervals, pushing alerts to the configured Alertmanager when conditions are triggered.
- Alertmanager receives an alert , according to the configuration , aggregation , de-emphasis , noise reduction , and finally issues a warning
4 Basic Types of Prometheus Monitoring Indicators
- Counter
Counter is the simplest type of metric we have. For example, if you want to count the total number of HTTP errors for a particular website, this is when you use a counter.
The value of the counter can only be increased or reset to 0, so it is particularly suitable for counting the number of occurrences at a given time on a given time period, i.e., the evolution of the indicator over time.
- Gauges
Gauges can be used to handle metrics that increase or decrease over time, such as memory changes, temperature changes.
This is probably the most common type of metrics, but it has some drawbacks: if the system sends metrics every 5 seconds, and the Pro service grabs the data every 15 seconds, some metrics may be lost in the meantime, and the accuracy of the results will slip if you do summary analysis calculations based on these data.
- Histogram
Histogram is a more complex type of metric. It provides additional information to our metrics, such as the sum and number of observations, and is often used to track the scale of events.
For example, to monitor performance metrics, we would like to send alerts when 20% of server requests take longer than 300 milliseconds to respond. For metrics involving proportions consider using a histogram.
- Summary
Summary is a little more advanced, is an extension of the histogram. In addition to providing sums and counts of observations, they also provide quantile measures on a sliding window. Quartiles are a way of dividing the probability density into equal probability ranges.
Application Scenario of Prometheus
DevOps
In order to observe whether the entire service system is functioning properly, Ops has a great need for monitoring systems. In the container world where instances are created as fast as they are destroyed, it is important to flexibly configure the monitoring items for each type of container and quickly install and start monitoring.
Read More: 4 Ways to Enhance Visibility& Unified Management on SONiC Open Network Switches
Fintech
Financial services giant Northern Trust chose Prometheus in June 2017, not for application monitoring, but to better understand how certain of its hardware was functioning.Northern Trust uses Prometheus to monitor more than 750 microservices on its platform.
Automotive
Life360, a mobile application for location, driving safety and information sharing among family members, needed to provide stable location services to their users, and their existing monitoring solutions were very limited and could not monitor the working status of all components.
What is Grafana?
https://github.com/grafana/grafana
Grafana is an open source interactive data-visualization platform, developed by Grafana Labs, which allows users to see their data via charts and graphs that are unified into one dashboard (or multiple dashboards) for easier interpretation and understanding.

How to Deploy Prometheus Monitoring Tools in Your Network?
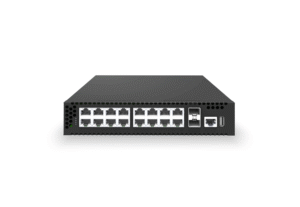
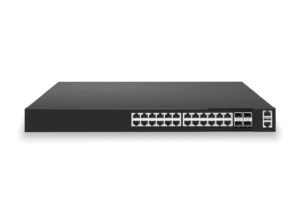
We have previously built a network monitoring system using the Asterfusion CX-M switch products (Campus Access Switches powered by enterprise ready SONiC ), Prometheus and Grafana panels for visualization and sending alert notifications to Slack. All of the monitoring software can be run on switch (as a docker) without the need for an additional server.
You can refer to this blog for the configuration steps: https://cloudswit.ch/blogs/prometheus-monitoring-poe-switches-slack-alert
Switch products involved: https://cloudswit.ch/product-category/sonic-access_aggregation_switch/