Table of Contents
Prometheus is an open source system monitoring and alerting toolkit. Since its launch in 2012, many companies and organizations have adopted Prometheus, and the project has a very active developer and user community.
For more detail about Prometheus, please read : https://cloudswit.ch/blogs/critical-information-you-should-know-about-open-source-network-monitoring-tools-and-prometheus/
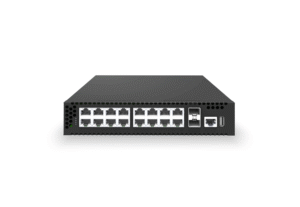
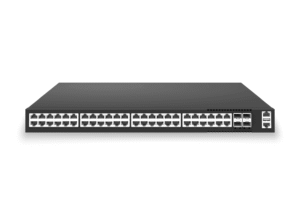
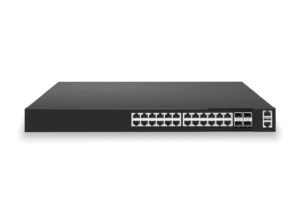
About Asterfusion SONiC-based Campus Switches (with optional PoE switch)
The Asterfusion family of SONiC switches for campus networks (CX-M series) is equipped with AsterNOS, an enterprise-ready SONiC with rich L2/L3 functionality and many other improvements in network virtualization and management. Asterfusion’s SONiC-based switches for campus networks now have a wide range of models from 1G to 100G, and each access-class switch is available in an optional PoE model.
Based on its rich functionality and high compatibility across multiple ASICs, we can build scalable, highly reliable campus access networks that are simpler and easier to configure and manage.
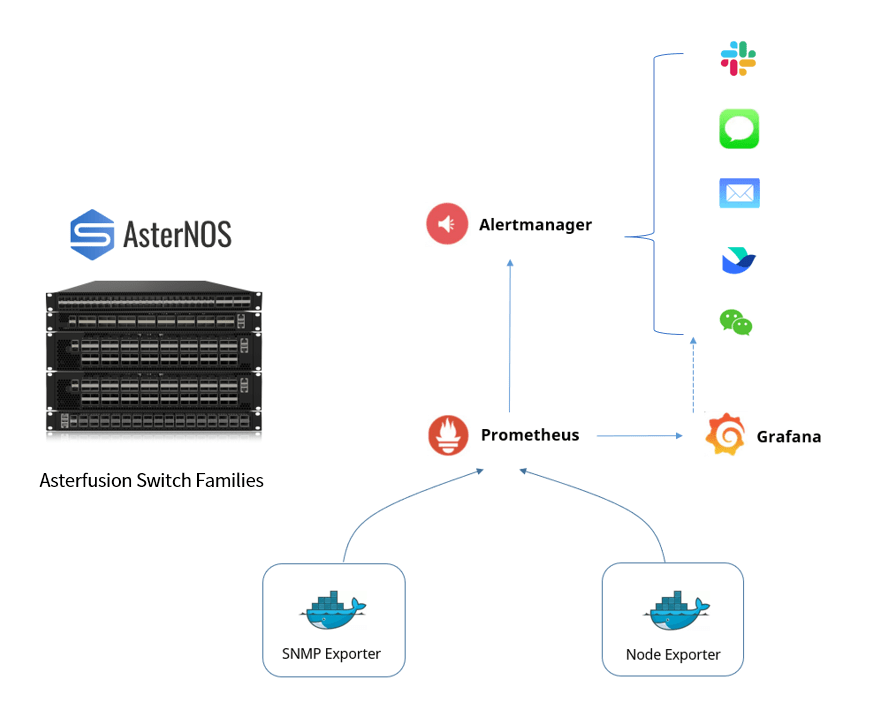
Today, we will configure a network monitoring system using the Asterfusion CX-M Series, Prometheus, and the Grafana panel for visualization. Thanks to the containerized architecture of AsterNOS, all monitoring-related software can be run on the CX-M switch and installed smoothly as a docker, and no extra server is required.
Monitoring Workflow Overview

Configuration Steps
Enable SNMP on CX-M
ASW-02(config)# feature state enable snmp
ASW-02(config)# snmp-agent source 10.110.0.6
ASW-02(config)# snmp-agent community public
ASW-02(config)# snmp-agent trap-target 2 10.230.1.11
Configurations of snmp exporter
- Generate snmp.yml file according to MIB file through generator program
- Install generator
[root@server1 ~]# sudo apt-get install unzip build-essential libsnmp-dev
[root@server1 ~]# go get github.com/prometheus/snmp_exporter/generator
[root@server1 ~]#cd /root/go/src/github.com/prometheus/snmp_exporter/generator
[root@server1 generator]# export MIBDIRS=/root/go/src/github.com/prometheus/snmp_exporter/generator/mibs- Upload MIB file to /root/go/src/github.com/prometheus/snmp_exporter/generator/mibs
- Configure generator.yml
[root@server1 generator]# vi generator.yml
---
auths:
  public_v1:
    version: 1
  public_v2:
    version: 2

modules:
  # Default IF-MIB interfaces table with ifIndex.
  asterfusion:
    walk: [sysUpTime, interfaces, ifXTable]
    lookups:
      - source_indexes: [ifIndex]
        lookup: ifAlias
      - source_indexes: [ifIndex]
        # Uis OID to avoid conflict with PaloAlto PAN-COMMON-MIB.
        lookup: 1.3.6.1.2.1.2.2.1.2 # ifDescr
      - source_indexes: [ifIndex]
        # Use OID to avoid conflict with Netscaler NS-ROOT-MIB.
        lookup: 1.3.6.1.2.1.31.1.1.1.1 # ifName
    overrides:
      ifAlias:
        ignore: true # Lookup metric
      ifDescr:
        ignore: true # Lookup metric
      ifName:
        ignore: true # Lookup metric
      ifType:
type: EnumAsInfo- Generate snmp.yml
[root@server1 generator]# go build
[root@server1 generator]# ./generator generate- Install snmp exporter in docker
[root@server1 opt]# mkdir /opt/snmp/conf
[root@server1 opt]# cp /root/go/src/github.com/prometheus/snmp_exporter/generator/snmp.yml /opt/snmp/conf/
[root@server1 opt]# docker run -v /opt/snmp/conf/: /etc/snmp_exporter -name snmp_exporter -p 9100:9100 prom/snmp-exporter- Visit snmp exporter via web browser


Configurations of Prometheus
- Install Prometheus in docker
[root@server1 opt]# docker run -d -p 9090:9090 -v /prometheus/:/etc/prometheus/ --name prometheus prom/prometheus - Edit configuration file
[root@server1 alertmanager]# docker exec -it prometheus sh
/prometheus $ cd /etc/prometheus/
/etc/prometheus $ vi prometheus.yml
Configurations of Grafana
- Install grafana in docker (10.230.1.11)
[root@server1 opt]# docker run -d -p 3000:3000 –name grafana grafana/grafana- Configure dashboard
Access to 10.230.1.11:3000 requires a password the first time. Once you log in and go to dashboard, you can create the panel. If you have already created a json file with the required display information, you can import that file directly into it (as we did).


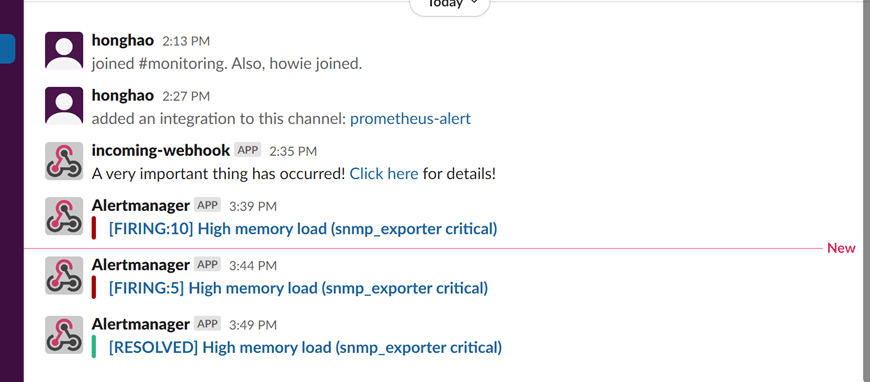
Configurations of Alertmanager
- Install and configure alertmanager in docker
[root@server1 opt]# docker run --name alertmanager -v /prometheus/alertmanager:/etc/alertmanager -d -p 9093:9093 quay.io/prometheus/alertmanager
[root@server1 opt]# vi /prometheus/alertmanager/alertmanager.yml- Integrate to Slack
- Create a separate Slack Channel for monitoring infomations

- Add an application( incomming webhooks) into the Monitoring channel


- Verify your webhook URL: copy the url and send test data using postman


3. Configure AlertManager
[root@server1 alertmanager]# vi alertmanager.yml
route:
  group_by: ['alertname']
  group_wait: 30s
  group_interval: 5m
  repeat_interval: 1h
  receiver: 'slack'

receivers:
  - name: 'slack'
    slack_configs:
      - api_url:
  "https://hooks.slack.com/services/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"
        channel: "#monitoring"
        send_resolved: true
inhibit_rules:
  - source_match:
      severity: 'critical'
    target_match:
      severity: 'critical'
    equal: ['alertname']
4. Set alerting rules
[root@server1 alertmanager]# docker exec -it prometheus sh
/prometheus $ cd
  /etc/prometheus/
/etc/prometheus $ vi
  test_rule.yml
groups:
- name:
  "snmp_exporter"
  rules:
  - alert: "High memory load"
    expr:
  afMemUtilization{job="snmp_exporter"} > 80
    for: 3m
    labels:
      severity: critical
    annotations:
      summary: "{{ $labels.instance }}
  high memory usage"
      description: " {{ $value }}% is
  too high"
5. Configure Prometheus: Add alertmanager and rule_files to Prometheus.yml
/etc/prometheus $ vi prometheus.yml
# Alertmanager
  configuration
alerting:
  alertmanagers:
    - static_configs:
        - targets:
  ["10.230.1.11:9093"]

# Load rules once and
  periodically evaluate them according to the global 'evaluation_interval'.
rule_files:
  - test_rule.yml
  # - "first_rules.yml"
  # - "second_rules.yml"
Result: We can receive alert information in this Slack channel along with a notification email.